Difference between revisions of "Specific IC 2118 information"
| (31 intermediate revisions by the same user not shown) | |||
| Line 1: | Line 1: | ||
| + | =The cloud= | ||
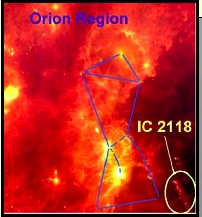
| − | This | + | [[Image:ic2118iras.jpg|right]]IC 2118, the Witch Head Nebula is a small cloud near the supergiant star Rigel in the constellation Orion. In the image at the right (taken by IRAS at 25 microns), IC 2118 is the structure at the bottom right corner. Rigel appears to be at least partially responsible for exciting and blowing off a significant portion of the nebula in this region. This cloud is about 210 parsecs away, similar in distance to the Orion Nebula Cluster (a.k.a. the ONC, or the sword of Orion). The ONC is a cluster of stars that are so bright that they too may be pushing around the gas and dust in the Witch Head Nebula. The ONC is sort of the "downtown", the "urban" area of star formation - lots of stars close together, lots of things going on all the time. There are so many stars here, so close together, that if we lived there, there would never be night. There are a ''lot'' of stars in the ONC!! Our cloud, the Witch Head Nebula, is sort of the "country." There are some things going on here, not a whole lot (especially in comparison to the ONC), but still interesting. |
| − | + | What we are trying to do is characterize the process of pre-main sequence stellar evolution in this cluster. We want to (a) find the young stars, and (b) compare star formation in this cluster with others from different environments (such as the much denser ONC) to see if there are similarities or differences. | |
| − | + | Previous all-sky surveys, including both IRAS and 2MASS, have included this region, but not to the resolution or the wavelengths that Spitzer can provide, and there are few studies of this particular region in the literature. | |
| − | Spitzer | + | ''Need to continue here with more information on a literature review'' |
| + | |||
| + | =The observations= | ||
| + | |||
| + | In our first observation of this region, we selected for observation by IRAC and MIPS a target area based on the IRAS survey and recent work conducted by Kun et al. (2004). Our Spitzer time was limited so we selected an area of the cloud near the "head" of the nebula that had a known IRAS source and 3 possible new classical T Tauri stars that were identified by Kun et al. In our second observation of this region, we were granted 11.5 hrs to go as far down the cloud as we could. We were able to go about 2.5 degrees down the cloud with both IRAC and MIPS. | ||
| + | |||
| + | [[Image:Ic2118_coverage.png]] | ||
| + | |||
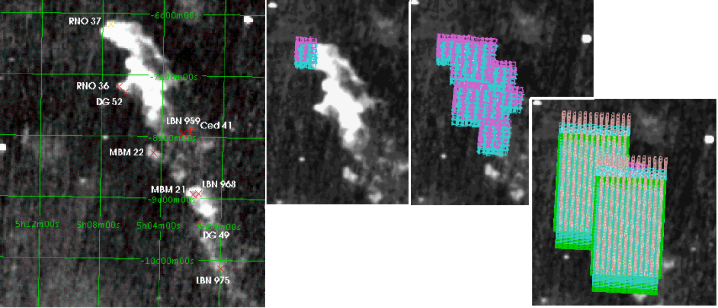
| + | On the left, previous objects in this region are indicated on top of a grayscale image in IRAS-25 (25 microns). In the center, the first year's coverage using IRAC is indicated. On the right, you can see the second year's coverage using IRAC (cyan and magenta) and MIPS (pink, blue, and green). | ||
| + | |||
| + | The observations we have cover a ''very'' large area. For comparison, the full moon is about half a degree across. Our mosaics are 2.5 degrees long, so 5 full moons long. Because these mosaics are so large, it takes a lot of computing power to create them. Luisa created our mosaics using a high-powered linux machine. It took about 45 hours to generate the IRAC mosaics, about 9 hours to generate the MIPS-1 (24 micron) mosaic, and about 3 hours to generate the MIPS-2 (70 micron) mosaics. | ||
| + | |||
| + | =Examining the mosaics= | ||
| + | |||
| + | to come. include warning that You may need to have a lot of RAM in your computer if you want to load in 3 or 4 of our mosaics all at the same time. | ||
| + | |||
| + | =A first look at the catalog with color-color plots= | ||
| + | this discussion will center on using color-color plots with the catalog. Need to emphasize here (and earlier) that many of the tools and techniques developed for IC 2118 will work in any other star-forming region observed with Spitzer. | ||
| + | |||
| + | =Examining special sources more in depth using SEDs= | ||
Latest revision as of 18:57, 23 February 2007
Contents
The cloud
IC 2118, the Witch Head Nebula is a small cloud near the supergiant star Rigel in the constellation Orion. In the image at the right (taken by IRAS at 25 microns), IC 2118 is the structure at the bottom right corner. Rigel appears to be at least partially responsible for exciting and blowing off a significant portion of the nebula in this region. This cloud is about 210 parsecs away, similar in distance to the Orion Nebula Cluster (a.k.a. the ONC, or the sword of Orion). The ONC is a cluster of stars that are so bright that they too may be pushing around the gas and dust in the Witch Head Nebula. The ONC is sort of the "downtown", the "urban" area of star formation - lots of stars close together, lots of things going on all the time. There are so many stars here, so close together, that if we lived there, there would never be night. There are a lot of stars in the ONC!! Our cloud, the Witch Head Nebula, is sort of the "country." There are some things going on here, not a whole lot (especially in comparison to the ONC), but still interesting.
What we are trying to do is characterize the process of pre-main sequence stellar evolution in this cluster. We want to (a) find the young stars, and (b) compare star formation in this cluster with others from different environments (such as the much denser ONC) to see if there are similarities or differences.
Previous all-sky surveys, including both IRAS and 2MASS, have included this region, but not to the resolution or the wavelengths that Spitzer can provide, and there are few studies of this particular region in the literature.
Need to continue here with more information on a literature review
The observations
In our first observation of this region, we selected for observation by IRAC and MIPS a target area based on the IRAS survey and recent work conducted by Kun et al. (2004). Our Spitzer time was limited so we selected an area of the cloud near the "head" of the nebula that had a known IRAS source and 3 possible new classical T Tauri stars that were identified by Kun et al. In our second observation of this region, we were granted 11.5 hrs to go as far down the cloud as we could. We were able to go about 2.5 degrees down the cloud with both IRAC and MIPS.
On the left, previous objects in this region are indicated on top of a grayscale image in IRAS-25 (25 microns). In the center, the first year's coverage using IRAC is indicated. On the right, you can see the second year's coverage using IRAC (cyan and magenta) and MIPS (pink, blue, and green).
The observations we have cover a very large area. For comparison, the full moon is about half a degree across. Our mosaics are 2.5 degrees long, so 5 full moons long. Because these mosaics are so large, it takes a lot of computing power to create them. Luisa created our mosaics using a high-powered linux machine. It took about 45 hours to generate the IRAC mosaics, about 9 hours to generate the MIPS-1 (24 micron) mosaic, and about 3 hours to generate the MIPS-2 (70 micron) mosaics.
Examining the mosaics
to come. include warning that You may need to have a lot of RAM in your computer if you want to load in 3 or 4 of our mosaics all at the same time.
A first look at the catalog with color-color plots
this discussion will center on using color-color plots with the catalog. Need to emphasize here (and earlier) that many of the tools and techniques developed for IC 2118 will work in any other star-forming region observed with Spitzer.

