Difference between revisions of "Hunting for Planets with CoRoT"
m (→CoRoT Data) |
|||
| Line 35: | Line 35: | ||
The default format for CoRoT data is FITS. These can be directly uploaded into the [[What is a periodogram? | NStED Periodogram Service]]. The periodogram service provides output of phased lightcurves in ascii text format. | The default format for CoRoT data is FITS. These can be directly uploaded into the [[What is a periodogram? | NStED Periodogram Service]]. The periodogram service provides output of phased lightcurves in ascii text format. | ||
| − | There are many useful FITS viewers which can be used to look at the FITS files directly. A good free viewer is Fv: The Interactive FITS File Editor. Another one is ds9. | + | There are many useful FITS viewers which can be used to look at the FITS files directly. A good free viewer is [http://heasarc.gsfc.nasa.gov/lheasoft/ftools/fv/ Fv: The Interactive FITS File Editor]. Another one is [http://hea-www.harvard.edu/RD/ds9/ ds9]. |
==Transit Fitting== | ==Transit Fitting== | ||
Revision as of 05:44, 12 August 2010
Based on materials originally developed by Stephen Kane (NStED/IPAC) for the 2010 Sagan Exoplanet Workshop. This group project was entitled "Hunting for Planets with CoRoT."
Contents
Introduction
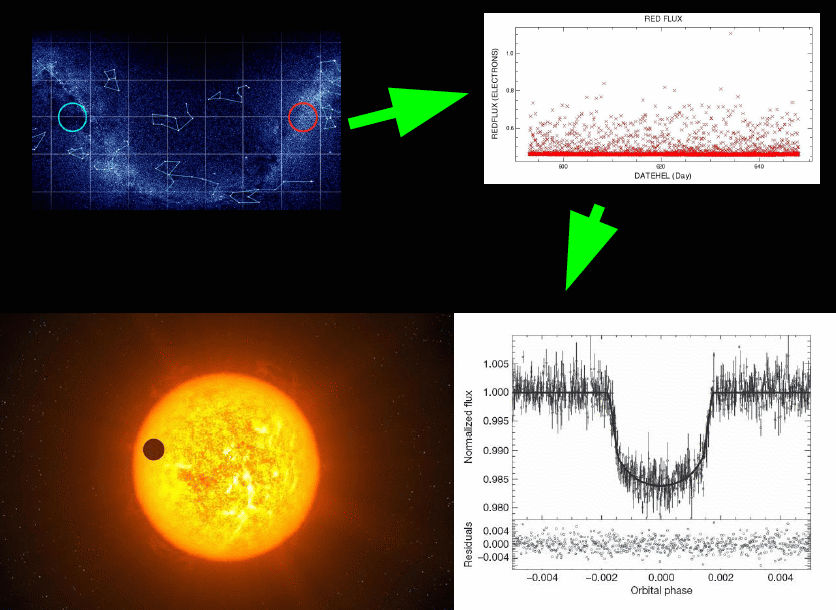
Here, in a nutshell, is the idea:
 Top left: CoRoT images things within one of two circles, shown here in red and cyan, on a map of the sky. Top right: You get light curves out. Bottom right: You can find transits, some of which will be planets (bottom left).
The Challenge
The transit method generally involves gathering LARGE datasets of RAW photometry. Are there signatures of one or more exoplanets in these data? Yes! But we need to know how to locate them. There are many noise sources which can disguise transit signatures. How do we filter these? There are astrophysical sources of noise also that can mimic the signature of an exoplanet (blended eclipsing binaries). We will simulate the end-to-end process using a subset of CoRoT data.
The Method
The NASA Star and Exoplanet Database (NStED) serves raw data from the CoRoT mission. You will become familiar with the CoRoT data products and the noise properties. Investigate the light curves using various techniques, including the NStED periodogram service which includes a Box-fitting Least Squares algorithm. You will identify periodic signatures within the light curves and determine their nature. In particular, some of the light curves contain the signature of a transiting exoplanet. You will locate these and characterize them (Seager & Mallen-Ornelas, 2003, ApJ, 585, 1038).
The Goals
- How to extract survey data from on-line archives.
- How to sift light curves for periodic signatures.
- What is the expected false-alarm rate vs the observed false-alarm rate?
- What kind of features manifest as false-alarms?
- How many transits are expected from a given survey? How many did we actually detect?
- What can we learn from transit light curves about the characteristics of the planet?
The Project
CoRoT Data
There are 52 lightcurves which have been extracted from the CoRoT portal via NStED. The ids for these objects are "here". The main task of this project is to detect and characterize as well as possible any signatures due to an exoplanet.
You can access the NStED CoRoT service here. I encourage you to take a look at this site and become familiar with how to download CoRoT data so that you can extract more data as necessary. Also see Accessing Kepler and CoRoT data for more information.
The default format for CoRoT data is FITS. These can be directly uploaded into the NStED Periodogram Service. The periodogram service provides output of phased lightcurves in ascii text format.
There are many useful FITS viewers which can be used to look at the FITS files directly. A good free viewer is Fv: The Interactive FITS File Editor. Another one is ds9.
Transit Fitting
There are several different approaches you might take to characterizing transit light curves. A good place to start is to read the papers by Mandel & Agol (2002) and Seager & Mallen-Ornelas (2003).
Kaspar von Braun has created an excel worksheet which utilizes the equations of the Seager & Mallen-Ornelas (2003) paper.
There is also the Transit Analysis Package Software by J. Z. Gazak (U. of Hawaii). Note that IDL is required to run this software. ( http://www.ifa.hawaii.edu/users/zgazak/TAP/ )