Difference between revisions of "Infrared Background"
m |
m |
||
| (2 intermediate revisions by the same user not shown) | |||
| Line 3: | Line 3: | ||
Sources of background noise in the infrared can be very different than those for optical astronomy. The structure of the background effectively increases its noise contribution above what would be calculated based on the flux contributed by all of the sources in a region. The structure contributes directly to the variance of the background as it would be measured by aperture or PSF-fitting photometry extraction software, for example. | Sources of background noise in the infrared can be very different than those for optical astronomy. The structure of the background effectively increases its noise contribution above what would be calculated based on the flux contributed by all of the sources in a region. The structure contributes directly to the variance of the background as it would be measured by aperture or PSF-fitting photometry extraction software, for example. | ||
| − | + | =[[Confusion| Source Confusion]]= | |
Source confusion itself is a source of background noise, and this is covered on a different page. | Source confusion itself is a source of background noise, and this is covered on a different page. | ||
| − | + | =Zodiacal Light= | |
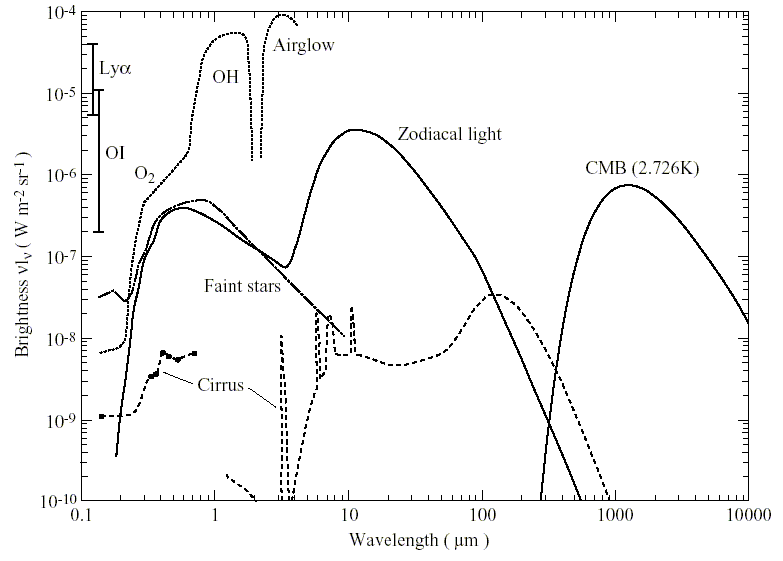
Optical astronomers do not often worry about Zodiacal light, but thermal emission from what is in essence our own remnant dust disk is a source of IR background. Scattered sunlight dominates this component of background at wavelengths shorter than 3.5 microns; at longer wavelengths, thermal emission from the particles themselves dominates this component. See the plot below for an indication of sky brightness as a function of wavelength; you can find more pictures of the Zodiacal light elsewhere on line or in astronomy textbooks. | Optical astronomers do not often worry about Zodiacal light, but thermal emission from what is in essence our own remnant dust disk is a source of IR background. Scattered sunlight dominates this component of background at wavelengths shorter than 3.5 microns; at longer wavelengths, thermal emission from the particles themselves dominates this component. See the plot below for an indication of sky brightness as a function of wavelength; you can find more pictures of the Zodiacal light elsewhere on line or in astronomy textbooks. | ||
{| border="1" | {| border="1" | ||
| − | |[[image:cobezodi. | + | |[[image:cobezodi.jpg]] |
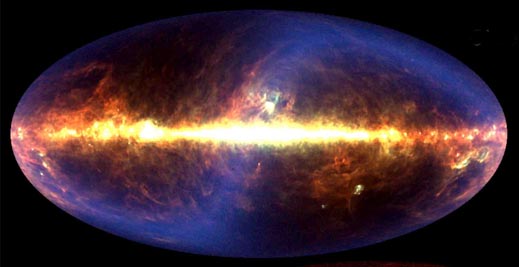
| − | | COBE/DIRBE image of the infrared sky. The S-shaped blue streak is the zodiacal light in the plane of our Solar System. | + | | COBE/DIRBE image of the infrared sky, in Galactic projection. The S-shaped blue streak is the zodiacal light in the plane of our Solar System. |
|} | |} | ||
| − | + | =Interstellar cirrus= | |
Emission from the interstellar medium dominates the sky brightness at wavelengths longer than 70 microns at high galactic latitudes, shifting to 45 microns at galactic latitudes around 10 degrees. In the galactic plane, the interstellar medium dominates at all wavelengths with a minimum around 20 microns. See the plot below for an indication of sky brightness as a function of wavelength. | Emission from the interstellar medium dominates the sky brightness at wavelengths longer than 70 microns at high galactic latitudes, shifting to 45 microns at galactic latitudes around 10 degrees. In the galactic plane, the interstellar medium dominates at all wavelengths with a minimum around 20 microns. See the plot below for an indication of sky brightness as a function of wavelength. | ||
| − | + | =Cosmic Background= | |
This is not the IR portion of the CMBR, but rather the integrated light of unresolved galaxies. | This is not the IR portion of the CMBR, but rather the integrated light of unresolved galaxies. | ||
Latest revision as of 18:47, 13 May 2011
Contents
Introduction
Sources of background noise in the infrared can be very different than those for optical astronomy. The structure of the background effectively increases its noise contribution above what would be calculated based on the flux contributed by all of the sources in a region. The structure contributes directly to the variance of the background as it would be measured by aperture or PSF-fitting photometry extraction software, for example.
Source Confusion
Source confusion itself is a source of background noise, and this is covered on a different page.
Zodiacal Light
Optical astronomers do not often worry about Zodiacal light, but thermal emission from what is in essence our own remnant dust disk is a source of IR background. Scattered sunlight dominates this component of background at wavelengths shorter than 3.5 microns; at longer wavelengths, thermal emission from the particles themselves dominates this component. See the plot below for an indication of sky brightness as a function of wavelength; you can find more pictures of the Zodiacal light elsewhere on line or in astronomy textbooks.

|
COBE/DIRBE image of the infrared sky, in Galactic projection. The S-shaped blue streak is the zodiacal light in the plane of our Solar System. |
Interstellar cirrus
Emission from the interstellar medium dominates the sky brightness at wavelengths longer than 70 microns at high galactic latitudes, shifting to 45 microns at galactic latitudes around 10 degrees. In the galactic plane, the interstellar medium dominates at all wavelengths with a minimum around 20 microns. See the plot below for an indication of sky brightness as a function of wavelength.
Cosmic Background
This is not the IR portion of the CMBR, but rather the integrated light of unresolved galaxies.
IR Background and Spitzer
At mid and low ecliptic latitudes, zodiacal light is the dominant source of background for IRAC, IRS, and MIPS 24 microns. The zodiacal background is very significant for the 8 micron channel in IRAC, and in fact sets the upper limit to exposure times by consuming the detector well depth. At mid and low galactic latitudes, the interstellar medium dominates, especially for the MIPS 160 microns. Use Spot to interactively calculate background estimates for targets. Source confusion is more difficult to quantify, but could be important, depending on where you are looking, which wavelength you use, and what exposure time you select. See the Confusion page for some additional references for confusion limits as they apply to Spitzer.
