Difference between revisions of "Luminous Data Miners Data Analysis"
From CoolWiki
Jump to navigationJump to search| (63 intermediate revisions by 5 users not shown) | |||
| Line 1: | Line 1: | ||
| + | '''Results and Analysis of Data from Chicago:''' | ||
| + | *This is our [[Media:Chicago_data_analysis_nov_2010.xls|Data Analysis ]] to see if there exists a correlation between the infrared and ultraviolet observations. This includes the data we are in the process of verifying. --[[User:Ramseyer|Ramseyer]] 15:02, 29 November 2010 (PST) | ||
| + | |||
| + | |||
| + | '''Results and Analysis of Data:''' | ||
| + | *This is the [[Media:Data Comparison.xls|Data Comparison Table ]] to see how the data between the different groups compares; created after conference call 11/22/10. The actual document is on GoogleDocs. uploaded by --[[User:Saathoff|Saathoff]] 13:54, 23 November 2010 (PST) | ||
| + | |||
| + | *[[Media:LDM_Data_Inga_20101119.xls|Data Analysis Table ]] by Inga [[User:Saathoff|Saathoff]] 17:43, 19 November 2010 (PST) The three plots to the right are also from the data in this table. | ||
| + | *Following to the Analysis, I was looking at the previously claimed non-AGN targets, and I came up with activity types for the targets as follows. The Activity Type LINER b (low-ionization nuclear emission region) as well as the starburst activity type are "possibly related to active galactic nuclei". --[[User:Saathoff|Saathoff]] 09:31, 20 November 2010 (PST) | ||
| + | |||
| + | {| border="4" cellpadding="2" | ||
| + | !| Target Name / Identification | ||
| + | !| Activity Type (NED) | ||
| + | !| Shows up w/ AGN in Plot (FUV-NUV/4.5-5.8) | ||
| + | |- | ||
| + | | NGC 1275 | ||
| + | | Sy 1.5 | ||
| + | | slight separation | ||
| + | |- | ||
| + | | NGC 2782 | ||
| + | | Starburst | ||
| + | | slight separation | ||
| + | |- | ||
| + | | M 83 | ||
| + | | -- | ||
| + | | slight separation | ||
| + | |- | ||
| + | | M 51a | ||
| + | | Sy 2 | ||
| + | | no | ||
| + | |- | ||
| + | | NGC 1097 | ||
| + | | LINER b | ||
| + | | yes | ||
| + | |- | ||
| + | | NGC 1365 | ||
| + | | Sy 1.8 | ||
| + | | slight separation | ||
| + | |- | ||
| + | | NGC 1808 | ||
| + | | H II | ||
| + | | yes | ||
| + | |- | ||
| + | | NGC 3621 | ||
| + | | -- | ||
| + | | slight separation | ||
| + | |- | ||
| + | | M 104 | ||
| + | | Sy 1.9 | ||
| + | | no | ||
| + | |- | ||
| + | | M 64 | ||
| + | | Sy | ||
| + | | slight separation | ||
| + | |} | ||
| + | |||
| + | Very interesting to me was that the Sy 1.9 and Sy 2 are in a completely different spot in the plot, however the non-AGN (NGC 3621 and M 83) fall very close to the other ones. --[[User:Saathoff|Saathoff]] 09:34, 20 November 2010 (PST) | ||
| + | |||
| + | [[File:LDM_Inga_1.gif|300px|thumb|right|FUV - NUV versus 5.8um data plotted. Neither a trend nor a separation between AGN and non-AGN sources seems obvious.--[[User:Saathoff|Saathoff]] 22:01, 19 November 2010 (PST)]] | ||
| + | |||
| + | [[File:LDM_Inga_2.gif|300px|thumb|right|FUV - NUV versus 4.5um data plotted. No trend, however a separation between AGN and non-AGN sources seems evident.--[[User:Saathoff|Saathoff]] 22:01, 19 November 2010 (PST)]] | ||
| + | |||
| + | [[File:LDM_Inga_3.gif|300px|thumb|right|FUV - NUV versus 4.5 - 5.8um data plotted. A trend between the colors seems present, only a minor separation between AGN and non-AGN targets.--[[User:Saathoff|Saathoff]] 22:01, 19 November 2010 (PST)]] | ||
| + | |||
| + | |||
| + | |||
| + | |||
| + | |||
| + | '''Results from Summer Visit in Pasadena, Ca 2010:''' | ||
| + | |||
*[[Media:ldm_Target_times.xls|Target List ]] from Team Oil City on Jul 16 showing the targets from this study and the observation times for data collection. | *[[Media:ldm_Target_times.xls|Target List ]] from Team Oil City on Jul 16 showing the targets from this study and the observation times for data collection. | ||
| Line 4: | Line 74: | ||
| − | *[[Media: | + | *[[Media:Ldm_allData_b.xls|Blank Data Table ]] Each team should download the blank data table. Fill in the table with measurements you have made and upload the modified file containing your data to this section of the Wiki. PLEASE make sure you include your name in the updated file name. |
| − | *[[Media: | + | *[[Media:Ldm_Data.xls|Data from Tristan + Inga ]] First six targets with Data from GALEX and targets 2 + 3 with Data from Spitzer; posted by Tristan and Inga --[[User:Saathoff|Saathoff]] 14:25, 21 July 2010 (PDT) |
*[[Media:Ldm_Targets_7-12.xls|Targets 7 - 12]] These are targets 7-12 posted by Darci and Domenic --[[User:Murtari|Murtari]] 15:19, 20 July 2010 (PDT) | *[[Media:Ldm_Targets_7-12.xls|Targets 7 - 12]] These are targets 7-12 posted by Darci and Domenic --[[User:Murtari|Murtari]] 15:19, 20 July 2010 (PDT) | ||
| Line 18: | Line 88: | ||
*[[Media:Ldm_Target_NilesMoreTargets.xls|Additional AGN]] These are two extra targets to try. Not in the original list.posted by Rozy and Elizabeth--[[User:Ramseyer|Ramseyer]] 15:54, 20 July 2010 (PDT) | *[[Media:Ldm_Target_NilesMoreTargets.xls|Additional AGN]] These are two extra targets to try. Not in the original list.posted by Rozy and Elizabeth--[[User:Ramseyer|Ramseyer]] 15:54, 20 July 2010 (PDT) | ||
| + | |||
| + | *[[Media:Ldm_Target_13-18 apt data update.xls| updated list]] This is the target list including apt data.--[[User:Mcnaughton|Mcnaughton]] 14:22, 21 July 2010 (PDT) | ||
| + | |||
| + | *[[Media:Ldm_Targets_10-11.xls|Spitzer Targets 10-11]] These is the Spitzer data for targets 10/11 posted by Darci and Domenic --[[User:Murtari|Murtari]] 14:21, 21 July 2010 (PDT) | ||
| + | **We are lacking a whole bunch of Spitzer data to be able to get some preliminary results; [[Media:Ldm_allData.xls|here]] is what I got so far out of all the spread sheets combined. --[[User:Saathoff|Saathoff]] 09:11, 24 July 2010 (PDT) | ||
| + | |||
| + | |||
| + | --[[User:Saathoff|Saathoff]] 08:45, 24 July 2010 (PDT): | ||
| + | *To convert the APT source intensities of the ''4.5um data'' into magnitudes you should try and insert in ''column N'' in the excel table the following formula: (and adjust the "M2" as necessary) | ||
| + | **'''=2.5*LOG10(179.7/(M2*10^(-6)))''' | ||
| + | |||
| + | *For the ''5.8um data'' you can insert the following in ''column S'': | ||
| + | **'''=2.5*LOG10(115/(R2*10^(-6)))''' | ||
| + | |||
| + | |||
| + | --[[User:Spuck|Spuck]] 11:24, 25 July 2010 (PDT) This is an initial data plot with 5 targets with trend line added ... need more data!!!. | ||
| + | *in this plot the FUV-NUV is on the X-axis; the 5.8um data is on the Y-axis... just for reference.--[[User:Saathoff|Saathoff]] 12:47, 25 July 2010 (PDT) | ||
| + | |||
| + | |||
| + | [[Image: LDM_data1.gif]] | ||
Latest revision as of 16:46, 5 September 2011
Results and Analysis of Data from Chicago:
- This is our Data Analysis to see if there exists a correlation between the infrared and ultraviolet observations. This includes the data we are in the process of verifying. --Ramseyer 15:02, 29 November 2010 (PST)
Results and Analysis of Data:
- This is the Data Comparison Table to see how the data between the different groups compares; created after conference call 11/22/10. The actual document is on GoogleDocs. uploaded by --Saathoff 13:54, 23 November 2010 (PST)
- Data Analysis Table by Inga Saathoff 17:43, 19 November 2010 (PST) The three plots to the right are also from the data in this table.
- Following to the Analysis, I was looking at the previously claimed non-AGN targets, and I came up with activity types for the targets as follows. The Activity Type LINER b (low-ionization nuclear emission region) as well as the starburst activity type are "possibly related to active galactic nuclei". --Saathoff 09:31, 20 November 2010 (PST)
| Target Name / Identification | Activity Type (NED) | Shows up w/ AGN in Plot (FUV-NUV/4.5-5.8) |
|---|---|---|
| NGC 1275 | Sy 1.5 | slight separation |
| NGC 2782 | Starburst | slight separation |
| M 83 | -- | slight separation |
| M 51a | Sy 2 | no |
| NGC 1097 | LINER b | yes |
| NGC 1365 | Sy 1.8 | slight separation |
| NGC 1808 | H II | yes |
| NGC 3621 | -- | slight separation |
| M 104 | Sy 1.9 | no |
| M 64 | Sy | slight separation |
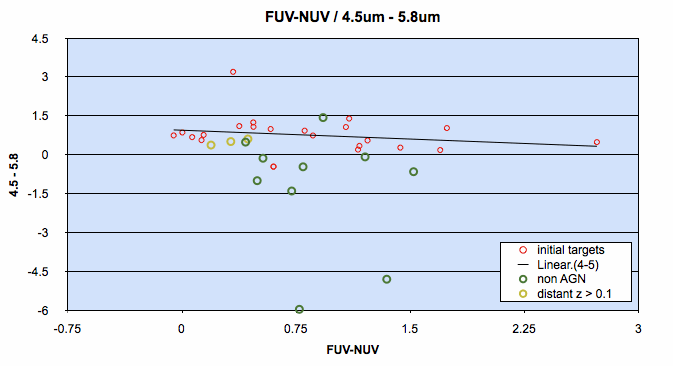
Very interesting to me was that the Sy 1.9 and Sy 2 are in a completely different spot in the plot, however the non-AGN (NGC 3621 and M 83) fall very close to the other ones. --Saathoff 09:34, 20 November 2010 (PST)

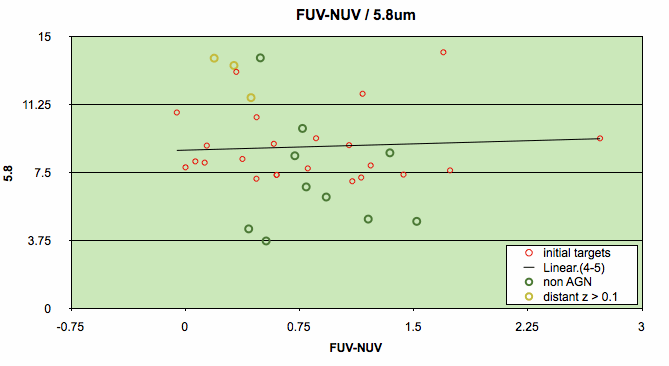
FUV - NUV versus 5.8um data plotted. Neither a trend nor a separation between AGN and non-AGN sources seems obvious.--Saathoff 22:01, 19 November 2010 (PST)

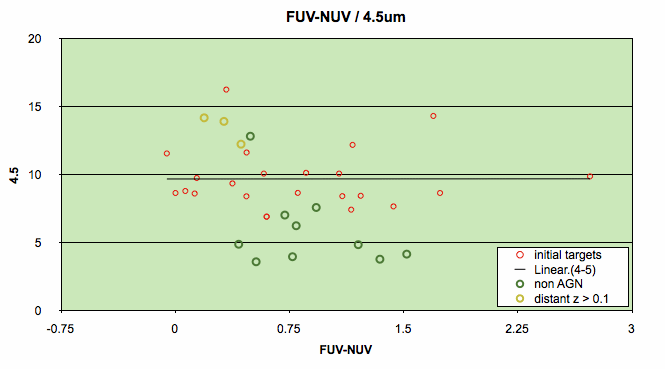
FUV - NUV versus 4.5um data plotted. No trend, however a separation between AGN and non-AGN sources seems evident.--Saathoff 22:01, 19 November 2010 (PST)

FUV - NUV versus 4.5 - 5.8um data plotted. A trend between the colors seems present, only a minor separation between AGN and non-AGN targets.--Saathoff 22:01, 19 November 2010 (PST)
Results from Summer Visit in Pasadena, Ca 2010:
- Target List from Team Oil City on Jul 16 showing the targets from this study and the observation times for data collection.
- Convert RA & DEC from HH:MM:SS to Degrees Use to check RA and DEC in our proposal with RA & DEC in GALEX --Spuck 15:22, 20 July 2010 (PDT)
- Blank Data Table Each team should download the blank data table. Fill in the table with measurements you have made and upload the modified file containing your data to this section of the Wiki. PLEASE make sure you include your name in the updated file name.
- Data from Tristan + Inga First six targets with Data from GALEX and targets 2 + 3 with Data from Spitzer; posted by Tristan and Inga --Saathoff 14:25, 21 July 2010 (PDT)
- Targets 7 - 12 These are targets 7-12 posted by Darci and Domenic --Murtari 15:19, 20 July 2010 (PDT)
- Targets 13-18 These the targets 13-18 by Tanya and Casey --Mcnaughton 15:20, 20 July 2010 (PDT)
- Targets 19-24 These are targets 19-24 by Ian and Zach --Thom 15:24, 20 July 2010 (PDT)
- Targets 25-30 These are targets 25-30 posted by Kevin and Eric --Hale 15:27, 20 July 2010 (PDT)
- Additional AGN These are two extra targets to try. Not in the original list.posted by Rozy and Elizabeth--Ramseyer 15:54, 20 July 2010 (PDT)
- updated list This is the target list including apt data.--Mcnaughton 14:22, 21 July 2010 (PDT)
- Spitzer Targets 10-11 These is the Spitzer data for targets 10/11 posted by Darci and Domenic --Murtari 14:21, 21 July 2010 (PDT)
--Saathoff 08:45, 24 July 2010 (PDT):
- To convert the APT source intensities of the 4.5um data into magnitudes you should try and insert in column N in the excel table the following formula: (and adjust the "M2" as necessary)
- =2.5*LOG10(179.7/(M2*10^(-6)))
- For the 5.8um data you can insert the following in column S:
- =2.5*LOG10(115/(R2*10^(-6)))
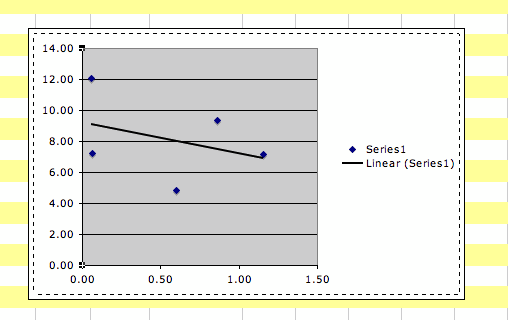
--Spuck 11:24, 25 July 2010 (PDT) This is an initial data plot with 5 targets with trend line added ... need more data!!!.
- in this plot the FUV-NUV is on the X-axis; the 5.8um data is on the Y-axis... just for reference.--Saathoff 12:47, 25 July 2010 (PDT)
