Difference between revisions of "Accessing Kepler and CoRoT data"
m |
m |
||
| (16 intermediate revisions by the same user not shown) | |||
| Line 1: | Line 1: | ||
| − | ''Based on materials developed by Peter Plavchan, | + | ''Based on materials developed by Peter Plavchan, NExScI/IPAC'' |
=File Formats= | =File Formats= | ||
| Line 21: | Line 21: | ||
**Cons: | **Cons: | ||
***Lack of standardized formatting -- e.g. tab vs. space vs. comma vs. fixed width, etc. | ***Lack of standardized formatting -- e.g. tab vs. space vs. comma vs. fixed width, etc. | ||
| − | ***Lack of standardized headers -- e.g. | + | ***Lack of standardized headers -- e.g. IPAC ASCII keywords and formatting |
***Larger file sizes | ***Larger file sizes | ||
=Kepler data= | =Kepler data= | ||
| + | |||
| + | Kepler stares at one field continuously. It produces light curves at a specific cadence for selected objects in its field of view. | ||
MAST is the official archive for Kepler. MAST=Multimission Archive at STScI, http://archive.stsci.edu | MAST is the official archive for Kepler. MAST=Multimission Archive at STScI, http://archive.stsci.edu | ||
This serves FITS light curves. | This serves FITS light curves. | ||
| − | + | The NASA Exoplanet Archive also serves Kepler data. http://exoplanetarchive.ipac.caltech.edu | |
This serves FITS and ASCII light curves. We also have a "value-added" statistics and periodogram tool (e.g., this is something you can't get from MAST) | This serves FITS and ASCII light curves. We also have a "value-added" statistics and periodogram tool (e.g., this is something you can't get from MAST) | ||
| Line 55: | Line 57: | ||
[[image:mast6.gif]] | [[image:mast6.gif]] | ||
| − | == | + | ==NASA Exoplanet Archive== |
| − | Unsurprisingly (because we developed it), we like this option better. :) We think it's easier to understand what is going on. | + | Unsurprisingly (because we developed it), we like this option better. :) We think it's easier to understand what is going on. Note that these screenshots are from an earlier version of the interface to the archive. |
Here is a screenshot of the search page: | Here is a screenshot of the search page: | ||
| Line 71: | Line 73: | ||
Here is an example of the search results. The most important things in this figure have an orange box around them. | Here is an example of the search results. The most important things in this figure have an orange box around them. | ||
[[image:nsted4.gif]] | [[image:nsted4.gif]] | ||
| + | |||
| + | This is an example of the light curve viewer. In this figure, the orange box indicates where to go to download the light curve itself: | ||
| + | [[image:nsted5.gif]] | ||
| + | |||
| + | The NASA Exoplanet Archive also allows you to compute a [[What is a periodogram?|periodogram]] from the light curve. Here is an example of what happens when you do that. The orange boxes in this figure indicate how to download the results of the periodogram analysis: | ||
| + | [[image:nsted6.gif]] | ||
| + | |||
| + | |||
| + | =CoRoT data= | ||
| + | |||
| + | CoRoT stares at a field for a long periods of time (up to 6 months), and then picks another field to observe. | ||
| + | |||
| + | CoRoT has two channels -- Asteroseismology (~10 targets/run) & Exoplanet (~10k targets/run) | ||
| + | Exoplanet light curves have two categories -- CHRomatic & MONochromatic, in separate binary FITS table files | ||
| + | Asteroseismology light curves come in three flavors --RAW, HELiocentric, & HELiocentric with REGularized time-sampling, all in one binary FITS file with 3 table extensions. | ||
| + | |||
| + | The NASA Exoplanet Archive is the official US portal for CoRoT data -- http://exoplanetarchive.ipac.caltech.edu -- It serves FITS light curves (ASCII coming soon). | ||
| + | |||
| + | IAS Data and Operations Center also serves the data, but in binary FITS table format -- http://idoc-corotn2-public.ias.u-psud.fr/index.jsp | ||
| + | |||
| + | Finally, there is also the CoRoT archive at LAEFF (in Spain); they serve binary FITS tables & ASCII format -- http://sdc.laeff.inta.es/corotfa/jsp/frontpage.jsp | ||
| + | |||
| + | ==NASA Exoplanet Archive== | ||
| + | |||
| + | From the front page, select the CoRoT option to access CoRoT data: | ||
| + | [[image:corot1.gif]] | ||
| + | |||
| + | Once again, you have several search options -- names, internal ids, etc.: | ||
| + | [[image:corot2.gif]] | ||
| + | |||
| + | Once you retrieve a light curve, this is what the screen looks like -- more options coming soon. Here, the orange box is highlighting how you download the actual data: | ||
| + | [[image:corot3.gif]] | ||
| + | |||
| + | ==IAS== | ||
| + | |||
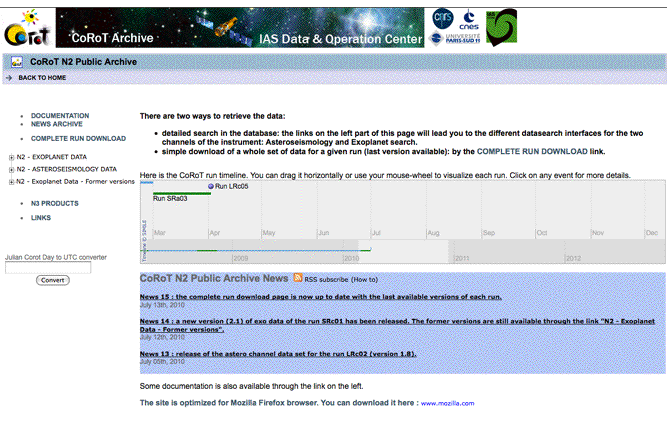
| + | Here is the search page at IAS: | ||
| + | |||
| + | [[image:ias1.gif]] | ||
| + | |||
| + | You can download whole runs, but note that (a) this is a European site, so "3,3 GB" means "3.3 GB" (note use of commas rather than decimal points), and (b) some of these files are quite large, like 18 GB. | ||
| + | [[image:ias2.gif]] | ||
| + | |||
| + | You can also search with different options: | ||
| + | [[image:ias3.gif]] | ||
| + | |||
| + | And this is the search results from that page: | ||
| + | [[image:ias4.gif]] | ||
| + | |||
| + | You can view light curves like this: | ||
| + | [[image:ias5.gif]] | ||
| + | |||
| + | Note: you can reasonably frequently encounter database errors when using this site. It's not you, it's them... | ||
| + | |||
| + | ==LAEFF== | ||
| + | |||
| + | Here is the page at LAEFF. Here, the orange box is indicating which is the important link you want: | ||
| + | [[image:laeff1.gif]] | ||
| + | |||
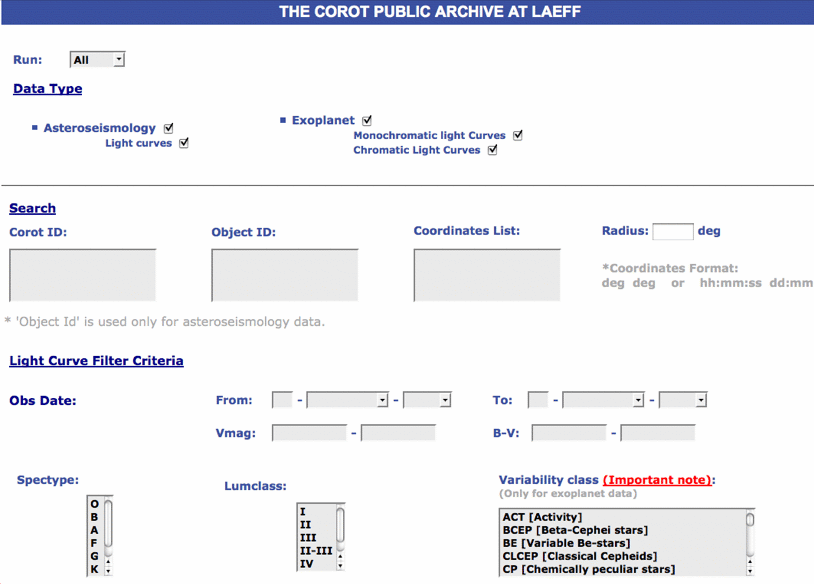
| + | Here is the search page: | ||
| + | [[image:laeff2.gif]] | ||
| + | |||
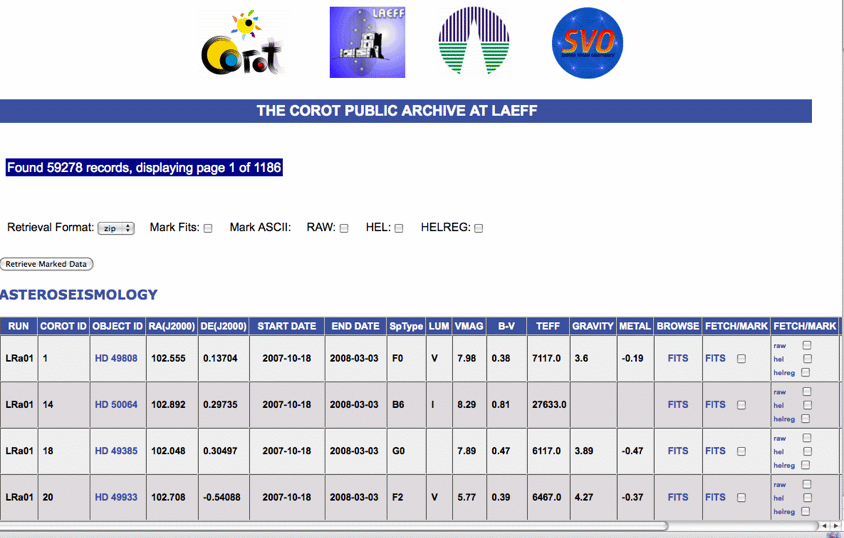
| + | And the search results -- the "browse" link goes to a Java plotting tool: | ||
| + | [[image:laeff3.gif]] | ||
Latest revision as of 17:55, 13 December 2011
Based on materials developed by Peter Plavchan, NExScI/IPAC
Contents
File Formats
First, a necessary aside on file formats. Modern time-series data sets are served in one of two formats:
- Binary FITS Tables
- Pros:
- Standard data format
- Compact file size
- Standard headers (FITS keywords)
- Supports inclusion of ancillary information
- Cons:
- Difficult to work with other visualization and manipulation tools -- e.g., how to plot, load into Excel?
- Fixed precision in data values – float or double – vs. formatting specified in somewhat obscure keywords
- 64-bit vs. 32-bit wonkiness from heritage tools (e.g. long doubles) (e.g., some tools assume 64-bit numbers and some assume 32-bit)
- Real life example: Original Kepler public data release introduced machine precision errors into time and position values larger than the other noise sources. (e.g., the real number should have been, say, 6.0045123056 and what got written to the file was shorter, say, 6.00451 -- that truncation introduced errors into the data that were much larger than any other noise source).
- Pros:
- ASCII
- Pros:
- (relatively) Easy to apply multiple tools -- IDL, Excel, mathematica, other plotting utilities can easily grab these files
- Precision tailored to data set -- if you want 6.0045123056 then you write 6.0045123056.
- Easier to directly investigate data values with simple file viewers
- Cons:
- Lack of standardized formatting -- e.g. tab vs. space vs. comma vs. fixed width, etc.
- Lack of standardized headers -- e.g. IPAC ASCII keywords and formatting
- Larger file sizes
- Pros:
Kepler data
Kepler stares at one field continuously. It produces light curves at a specific cadence for selected objects in its field of view.
MAST is the official archive for Kepler. MAST=Multimission Archive at STScI, http://archive.stsci.edu This serves FITS light curves.
The NASA Exoplanet Archive also serves Kepler data. http://exoplanetarchive.ipac.caltech.edu This serves FITS and ASCII light curves. We also have a "value-added" statistics and periodogram tool (e.g., this is something you can't get from MAST)
MAST
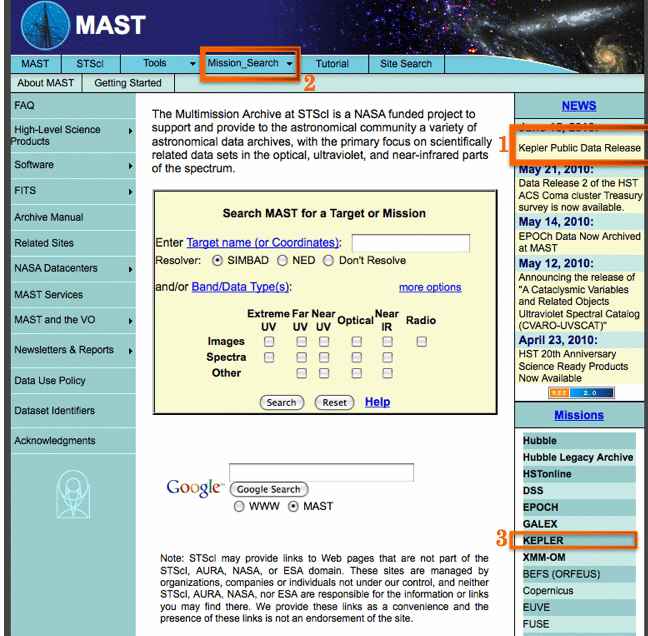
Here is a screenshot -- there are three different ways to find Kepler data, which are circled in orange here:
When you get to the Kepler archive, these are the relevant files (circled in orange) that you want:
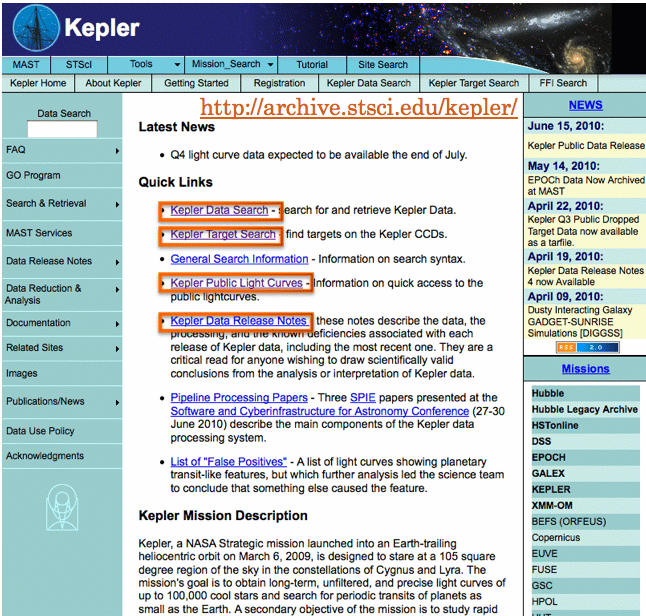
e.g., the interactive data search, the target search, the public light curves, and the data release notes.
You can download all the public light curves at once in one GIGANTIC tarfile -- like 11 GB.
Their search form looks like this:
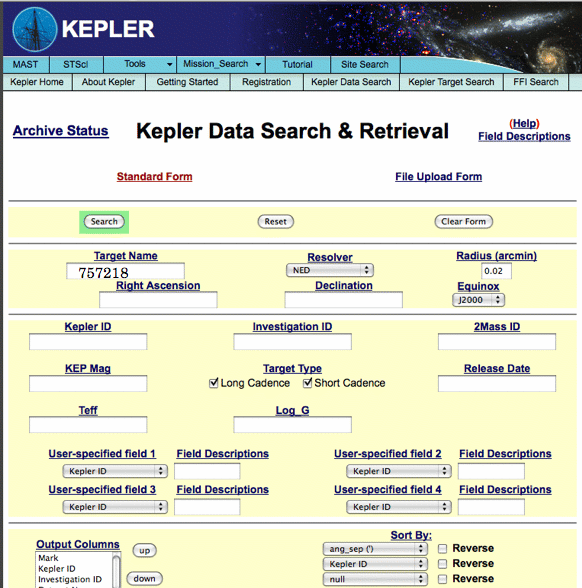
And the search results look like this (the buttons circled in orange are the ones you want):
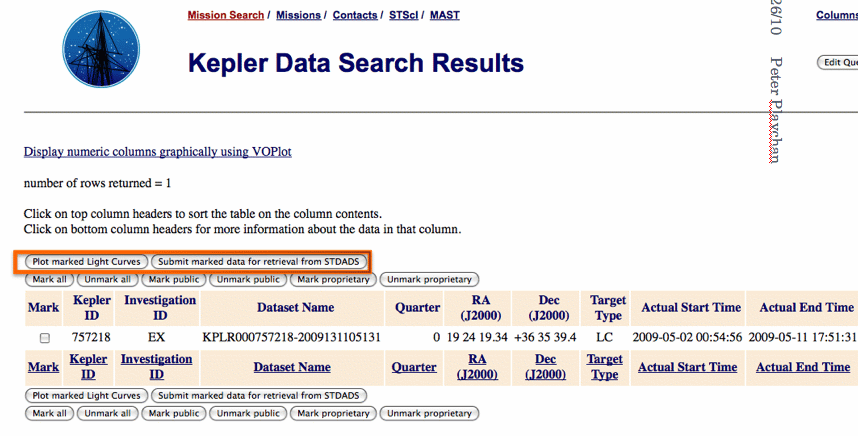
This is what happens when you ask it to plot up that light curve:
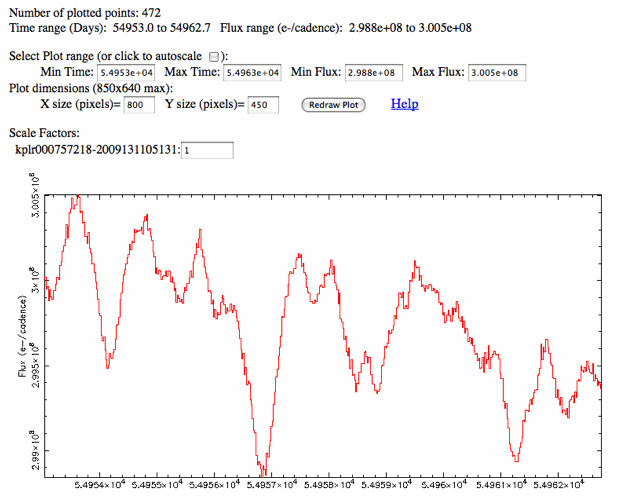
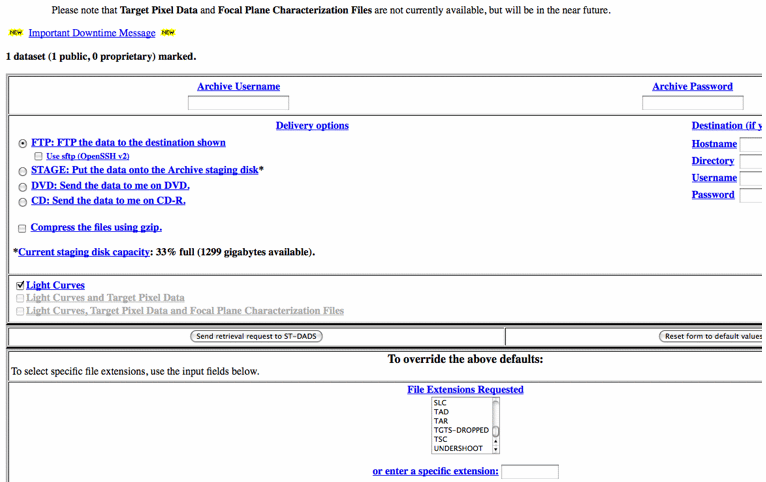
You can then choose to download the data; that screen looks like this:
NASA Exoplanet Archive
Unsurprisingly (because we developed it), we like this option better. :) We think it's easier to understand what is going on. Note that these screenshots are from an earlier version of the interface to the archive.
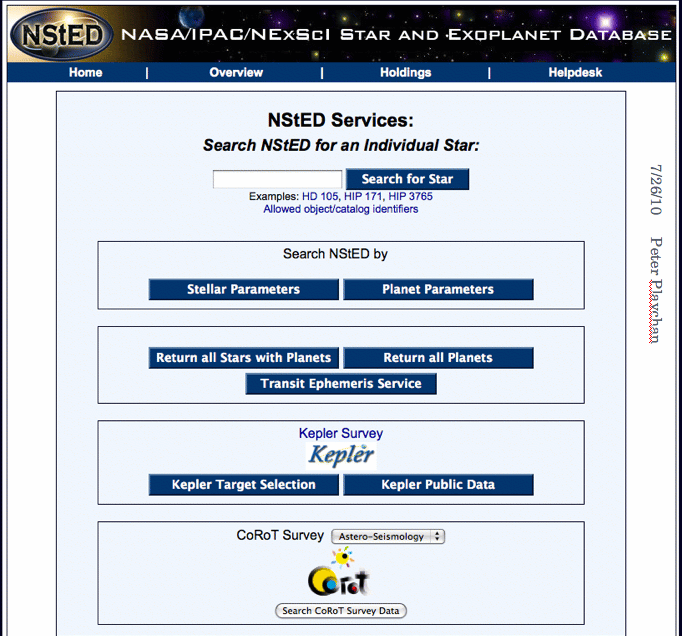
Here is a screenshot of the search page:
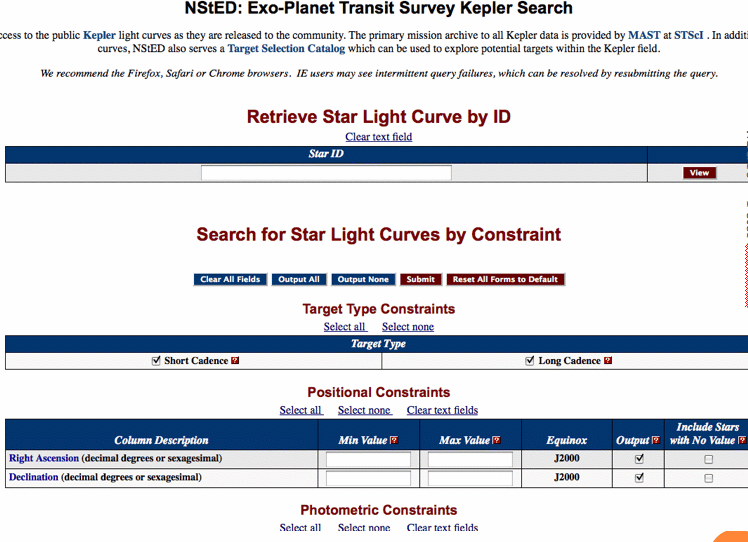
Of course, for Kepler data, hit the Kepler button.
Here is a screenshot of the Kepler search page:
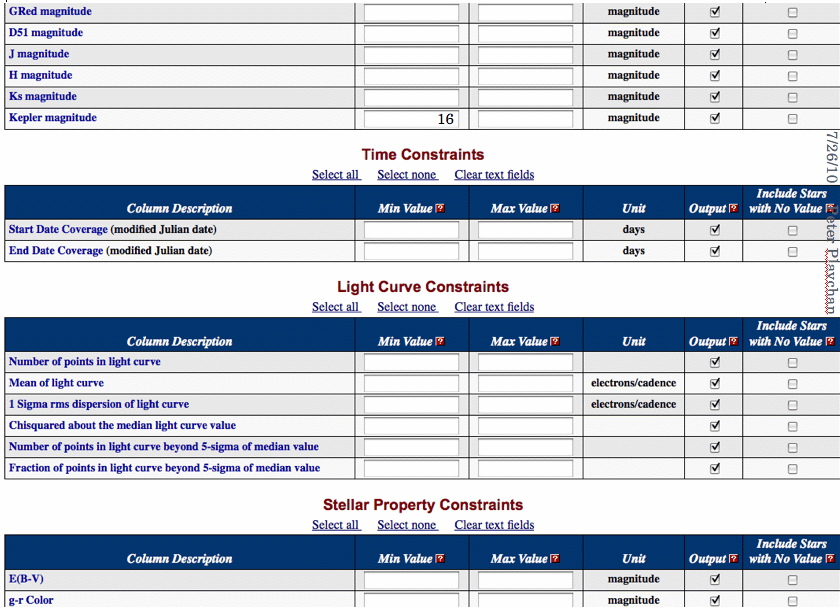
Note that you can search with a wide variety of constraints, like color, dispersion, etc.:
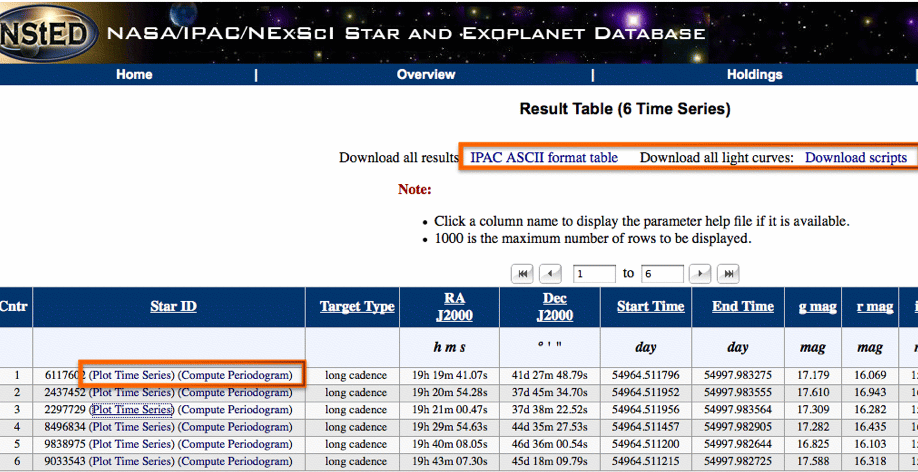
Here is an example of the search results. The most important things in this figure have an orange box around them.
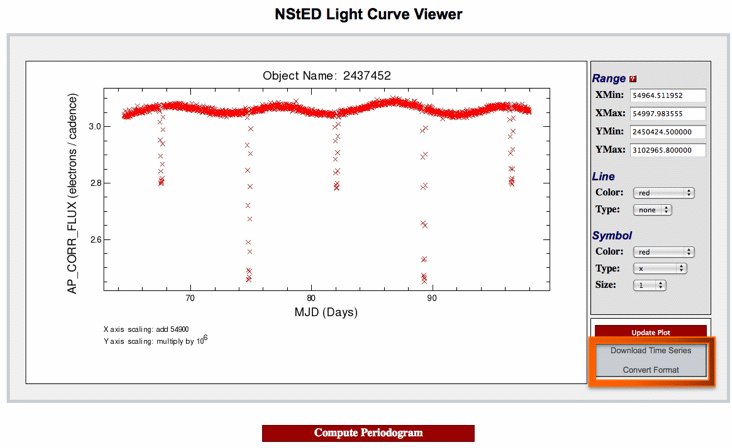
This is an example of the light curve viewer. In this figure, the orange box indicates where to go to download the light curve itself:
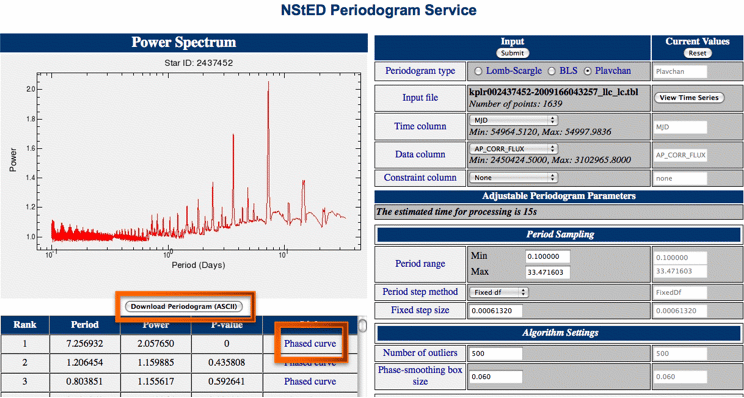
The NASA Exoplanet Archive also allows you to compute a periodogram from the light curve. Here is an example of what happens when you do that. The orange boxes in this figure indicate how to download the results of the periodogram analysis:
CoRoT data
CoRoT stares at a field for a long periods of time (up to 6 months), and then picks another field to observe.
CoRoT has two channels -- Asteroseismology (~10 targets/run) & Exoplanet (~10k targets/run) Exoplanet light curves have two categories -- CHRomatic & MONochromatic, in separate binary FITS table files Asteroseismology light curves come in three flavors --RAW, HELiocentric, & HELiocentric with REGularized time-sampling, all in one binary FITS file with 3 table extensions.
The NASA Exoplanet Archive is the official US portal for CoRoT data -- http://exoplanetarchive.ipac.caltech.edu -- It serves FITS light curves (ASCII coming soon).
IAS Data and Operations Center also serves the data, but in binary FITS table format -- http://idoc-corotn2-public.ias.u-psud.fr/index.jsp
Finally, there is also the CoRoT archive at LAEFF (in Spain); they serve binary FITS tables & ASCII format -- http://sdc.laeff.inta.es/corotfa/jsp/frontpage.jsp
NASA Exoplanet Archive
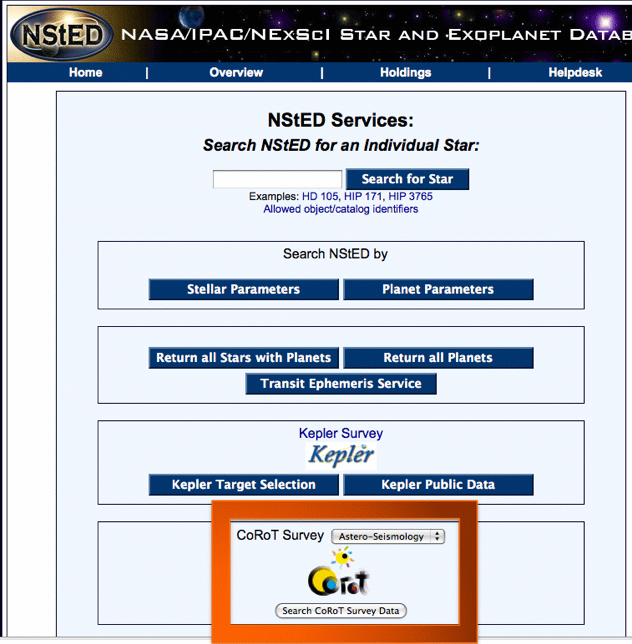
From the front page, select the CoRoT option to access CoRoT data:
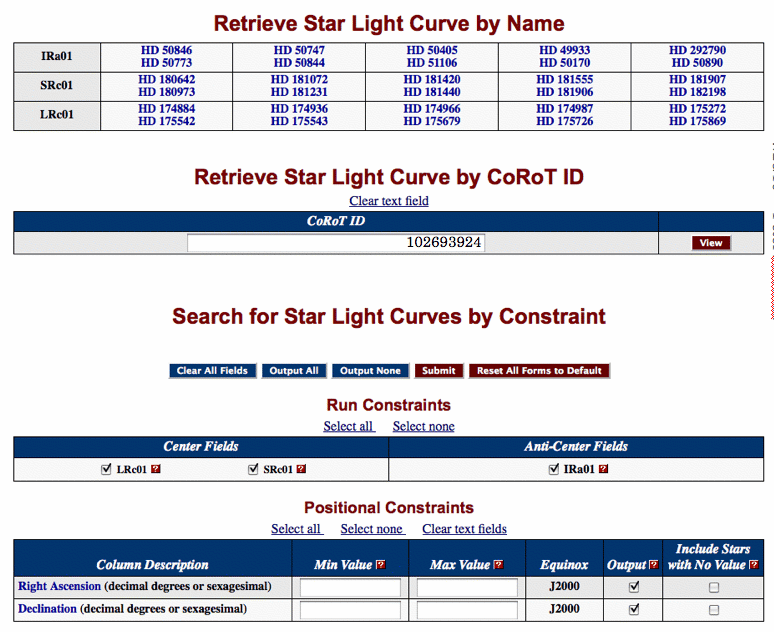
Once again, you have several search options -- names, internal ids, etc.:
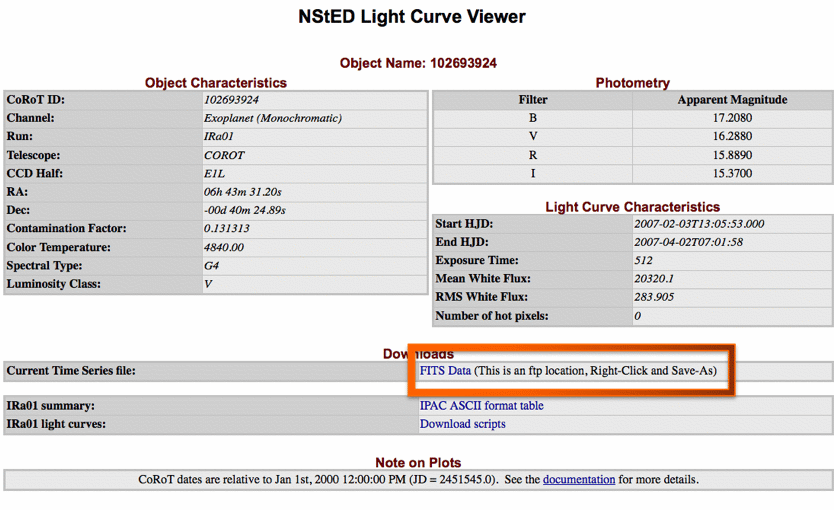
Once you retrieve a light curve, this is what the screen looks like -- more options coming soon. Here, the orange box is highlighting how you download the actual data:
IAS
Here is the search page at IAS:
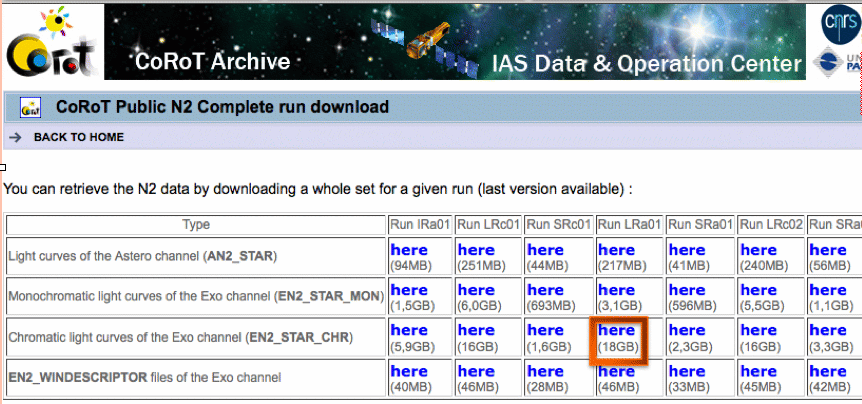
You can download whole runs, but note that (a) this is a European site, so "3,3 GB" means "3.3 GB" (note use of commas rather than decimal points), and (b) some of these files are quite large, like 18 GB.
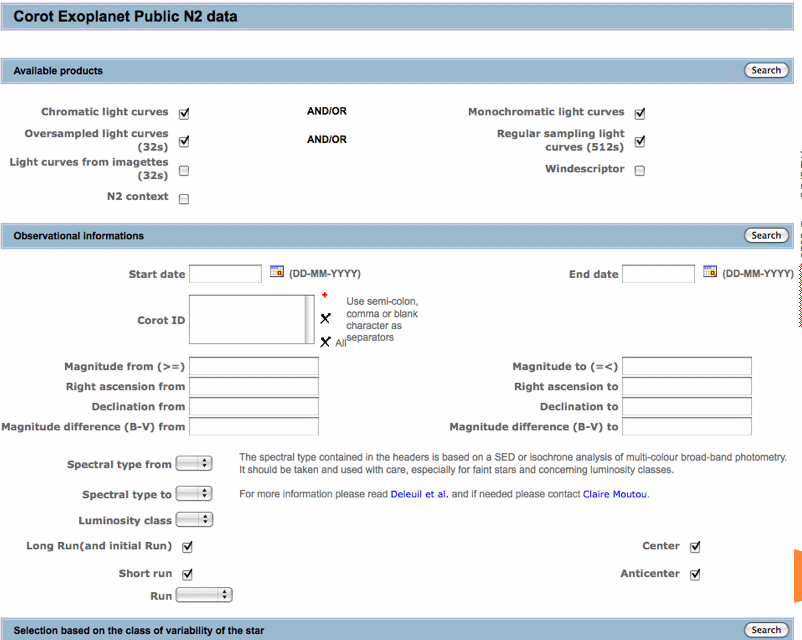
You can also search with different options:
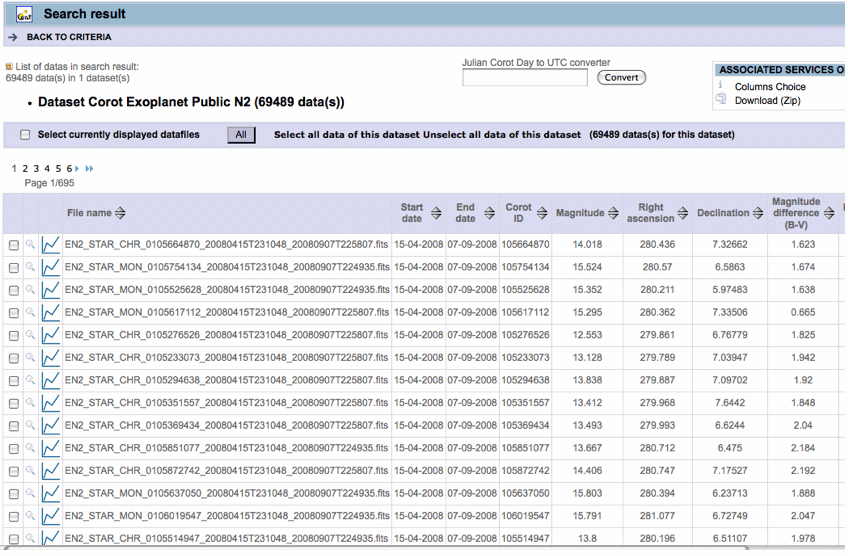
And this is the search results from that page:
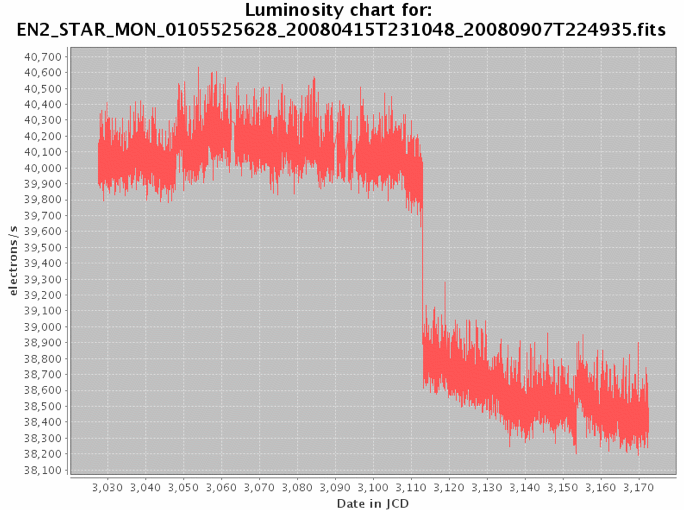
You can view light curves like this:
Note: you can reasonably frequently encounter database errors when using this site. It's not you, it's them...
LAEFF
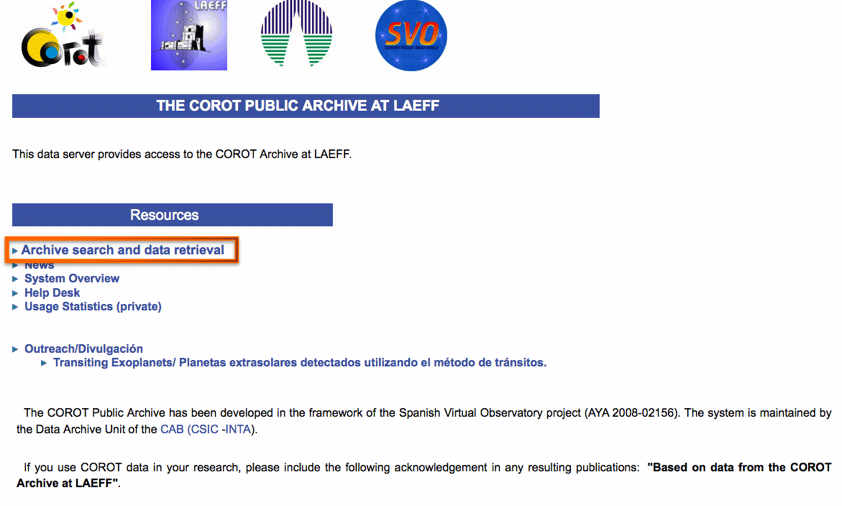
Here is the page at LAEFF. Here, the orange box is indicating which is the important link you want:
And the search results -- the "browse" link goes to a Java plotting tool:
