Difference between revisions of "What is a periodogram?"
m (Created page with '''This is from material originally developed by Peter Plavchan, NStED/IPAC.'' =What is a periodogram?= A periodogram calculates the significance of different frequencies in tim…') |
m |
||
| Line 2: | Line 2: | ||
=What is a periodogram?= | =What is a periodogram?= | ||
| + | |||
| + | When you have a light curve, sometimes your eye can see repeated patterns in it. Sometimes your eye can be fooled, though -- things that seem periodic might not be, and it may seem like you have a noisy light curve, but it may turn out that you are sampling many repeated cycles of a periodic variation. | ||
| + | |||
| + | In order to look for periodic signals, there are several mathematical tools. A periodogram is one of them. There are lots of good textbooks on this subject; this wiki page is meant as just a quick introduction. | ||
A periodogram calculates the significance of different frequencies in time-series data to identify any intrinsic periodic signals. | A periodogram calculates the significance of different frequencies in time-series data to identify any intrinsic periodic signals. | ||
| − | A periodogram is similar to the Fourier Transform, but is optimized for unevenly time-sampled data, and for different shapes in periodic signals. | + | A periodogram is similar to the Fourier Transform, but is optimized for unevenly time-sampled data, and for different shapes in periodic signals. Unevenly sampled data is particularly common in astronomy, where your target might rise and set over several nights, or you have to stop observing with your spacecraft to download the data. |
| − | A periodogram is brute-force. Many different frequencies | + | A periodogram is brute-force. Many different frequencies and candidate periodic signals are evaluated. |
The statistical significance of each frequency is computed based upon a series of algebraic operations that depend on the particular algorithm used and periodic signal shape assumed. | The statistical significance of each frequency is computed based upon a series of algebraic operations that depend on the particular algorithm used and periodic signal shape assumed. | ||
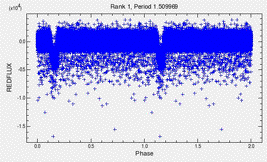
| − | Example: light curve for CoRoT-1: [[image:period1.gif]] and periodogram for it: [[image:period2.gif]] | + | Example: light curve for CoRoT-1: [[image:period1.gif]] |
| + | |||
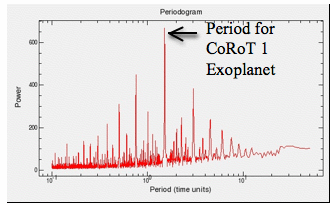
| + | and periodogram for it: [[image:period2.gif]] | ||
| + | |||
| + | |||
| + | =Why look for periods?= | ||
| + | |||
| + | A variety of astrophysical phenomena can produce periodic time-series data, including: | ||
| + | *Stellar variability | ||
| + | *Eclipsing binaries | ||
| + | *Transiting planets | ||
| + | *Radial velocity planets | ||
| + | |||
| + | Time-series data of astrophysical objects are inherently noisy measurements -- photon noise, atmospheric conditions and other factors can introduce random variation into the magnitude of the observations. | ||
| + | |||
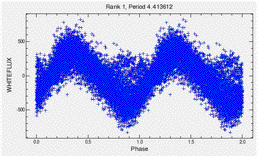
| + | Example: phased light curve for CoRoT source showing possible variation: [[image:period3.gif]] | ||
| + | |||
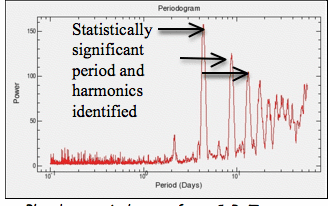
| + | and Plavchan periodogram for it: [[image:period4.gif]] | ||
Revision as of 06:48, 11 August 2010
This is from material originally developed by Peter Plavchan, NStED/IPAC.
What is a periodogram?
When you have a light curve, sometimes your eye can see repeated patterns in it. Sometimes your eye can be fooled, though -- things that seem periodic might not be, and it may seem like you have a noisy light curve, but it may turn out that you are sampling many repeated cycles of a periodic variation.
In order to look for periodic signals, there are several mathematical tools. A periodogram is one of them. There are lots of good textbooks on this subject; this wiki page is meant as just a quick introduction.
A periodogram calculates the significance of different frequencies in time-series data to identify any intrinsic periodic signals.
A periodogram is similar to the Fourier Transform, but is optimized for unevenly time-sampled data, and for different shapes in periodic signals. Unevenly sampled data is particularly common in astronomy, where your target might rise and set over several nights, or you have to stop observing with your spacecraft to download the data.
A periodogram is brute-force. Many different frequencies and candidate periodic signals are evaluated.
The statistical significance of each frequency is computed based upon a series of algebraic operations that depend on the particular algorithm used and periodic signal shape assumed.
Example: light curve for CoRoT-1: 
Why look for periods?
A variety of astrophysical phenomena can produce periodic time-series data, including:
- Stellar variability
- Eclipsing binaries
- Transiting planets
- Radial velocity planets
Time-series data of astrophysical objects are inherently noisy measurements -- photon noise, atmospheric conditions and other factors can introduce random variation into the magnitude of the observations.
Example: phased light curve for CoRoT source showing possible variation: 

