Difference between revisions of "How do I download data from Spitzer?"
m |
m |
||
| Line 49: | Line 49: | ||
[[Image: shapositionsearchstart2.png]] | [[Image: shapositionsearchstart2.png]] | ||
| − | 6. Maybe you are only interested in IRAC data? Or just MIPS-24 data? Pick which you want. The default is to return everything. If you want to, e.g., turn off all IRS search results, click on the checkbox next to "All IRS." (And similarly for the other instruments.) NOW, click "search." | + | 6. Maybe you are only interested in IRAC data? Or just MIPS-24 data? Pick which you want. The default is to return everything. If you want to, e.g., turn off all IRS search results, click on the checkbox next to "All IRS." (And similarly for the other instruments.) If you want to search by wavelength instead (maybe you don't remember which channel is which on IRAC), you can also search by wavelength: |
| + | |||
| + | [[Image: shapositionsearchstart3.png]] | ||
| + | |||
| + | NOW, click "search." | ||
Revision as of 23:42, 23 April 2010
Contents
- 1 Don't forget to try and answer the "Questions to think about ..." at the bottom of this page!
- 2 Downloading data: the basics, and generic instructions
- 3 I STOPPED EDITING HERE
- 4 Downloading Data: How can I find already-reduced Spitzer data?
- 5 Downloading Data: How can I find any prior observations for an object?
- 6 Downloading Data: How can I quickly get a mosaic of my object?
- 7 Downloading Data: I need the image as a FITS file, how can I get this?
- 8 Downloading Data: What should I do if there is more than one mosaic of the same object?
- 9 Downloading Data: How can I get a spectrum of my object?
- 10 Downloading Data: I'm ready to advance to a highly technical and in-depth discussion on downloading Spitzer data.
- 11 Questions to think about and things to try with Spot/Leopard
- 12 Possibly useful resources
Don't forget to try and answer the "Questions to think about ..." at the bottom of this page!
Downloading data: the basics, and generic instructions
Introduction
The Spitzer Heritage Archive (SHA) is the permanent home for all of the data collected during the Spitzer mission, plus all the documentation you need to understand it all. The SHA will eventually be formally part of IRSA's archive holdings. Right now (as of May 2010), the SHA is still being developed, though it is quite operational now. If you get started using it now, you may be able to influence some of the features that are incorporated! Right now, it contains most of the cryogenic Spitzer data.
The SHA is a web-based interface to the Spitzer archive, and it lives here: http://irsa.ipac.caltech.edu/applications/Spitzer/SHA/ Because it is web-based, you no longer need to download and install software that is platform-dependent. It should "just work" in whatever browser you use! There is online help for the SHA -- see the help menu in the upper right (of the red menu bar). There is no separate, downloadable User Guide yet. There will be.
The software that used to be the primary mechanism for pulling data from the archive is called Leopard. Leopard has some powerful visualization tools incorporated into it, and ultimately all of those same tools will be available from within the SHA, just with a different interface. (see "questions to think about" below!)
Basic Terminology
With the new interface comes some new terminology. Just in case you have been working with Spitzer data before, I'm including some of the older terms for these things. However, the newer terms are now supposed to be the primary terms for these things!
An individual Spitzer observation sequence is an AOR, or Astronomical Observation Request. In certain cases (often calibration or sometimes science observations), you may also see an IER, or Instrument Engineering Request. Either one involves many individual frames, as well as observer name, date of observation, object or area of the sky observed, and instrument used (IRAC, MIPS, or IRS)-- these are all part of the AOR. All of Spitzer's operations (planning, scheduling, processing) have been centered around these units (AORs or IERs). Now, for the SHA, we are starting to move away from that, but there are some things that are still only available on an AOR basis, so we really can't escape them.
The rest of the new terminology has its origin in other similar terms used in other archives. I know, I know, hard to think about astronomers using the same terms to mean the same thing across multiple telescopes and wavelengths! But we're trying...
Raw data that are fundamentally unprocessed are "Level 0" data. As NITARP folks, you should never encounter (or want to encounter, really) Level 0 data.
The individual data frames that emerge, calibrated, from the Spitzer pipeline are "Level 1," or "Basic Calibrated Data," or "BCDs." New with the SHA, you can now get just the BCDs from a region that you want; you no longer have to download the whole thing. As NITARP folks, you probably don't need these Level 1 data. But you might.
The products that come from combining these individual data frames (such as mosaics) are "Level 2," or "post-BCD," or "PBCD data." These still exist fundamentally on an AOR level, e.g., you can't get a Level 2 mosaic that is just a portion of an AOR. As NITARP folks, you probably want these data.
Not right now, but eventually, you will also be able to get "Level 3" data. These products will be supplemental data that are produced either by the SSC or donated to us by professional astronomers, and represent additional processing. For example, a Level 3 mosaic might combine data from 7 AORs into one big mosaic, with customized (as opposed to hands-off pipeline) processing of image artifacts. If you are familiar with the Legacy Enhanced Products, these are also examples of Level 3 data. As soon as these data are available, as NITARP folks, these are the data you're probably going to want.
All of the images come in FITS format. (Wondering what is FITS format?) (If you are really savvy, you might also care that they are mostly single-plane FITS files. Some Level 3 products will be/are multi-plane FITS.) The other format for some data is IPAC table files (.tbl extension). IPAC table format is really just plain text, with a special header. Once you get a file like this, just about anything (including Excel) can read it.
Simplest Search
1. Go to the SHA: http://irsa.ipac.caltech.edu/applications/Spitzer/SHA/
2. Click on "Search the Heritage Archive."
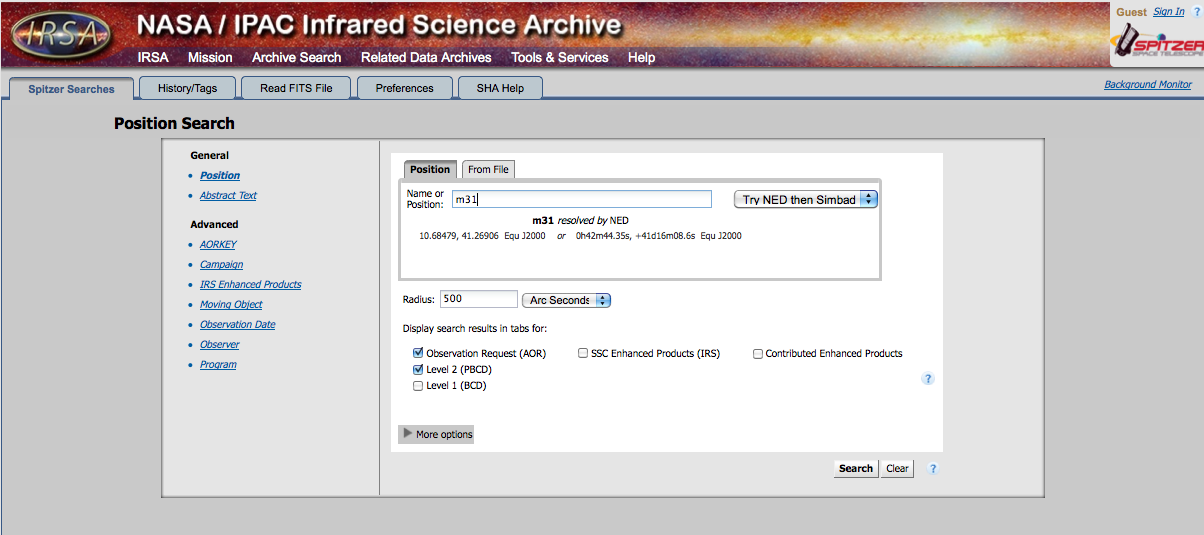
3. You are dropped into a "postion search." (There are other search options on the left.) Type in the name of an object you care about. The machine will automatically resolve the name, e.g., turn the name into coordinates. You can choose which service does this name resolution - NED or SIMBAD. If you have something extragalactic, NED is better; if you have something else, SIMBAD works better.
4. Now, from here, it's just fine to hit search. BUT, maybe you want to customize things further. The additional options, as seen in the box above, are:
- search radius -- change the units, type in the number you want.
- apply spatial constraints -- do you want it to return whole AORs, or just the region within your search radius?
- display search results -- which data products do you want? That's important. Let me repeat that, in bold: which data products do you want? Look above, under "Basic Terminology." In all liklihood, you want the AORs and the Level 2 (post-BCD) data. In my picture above, I also have Level 1 (BCD) checked, but that's me. :)
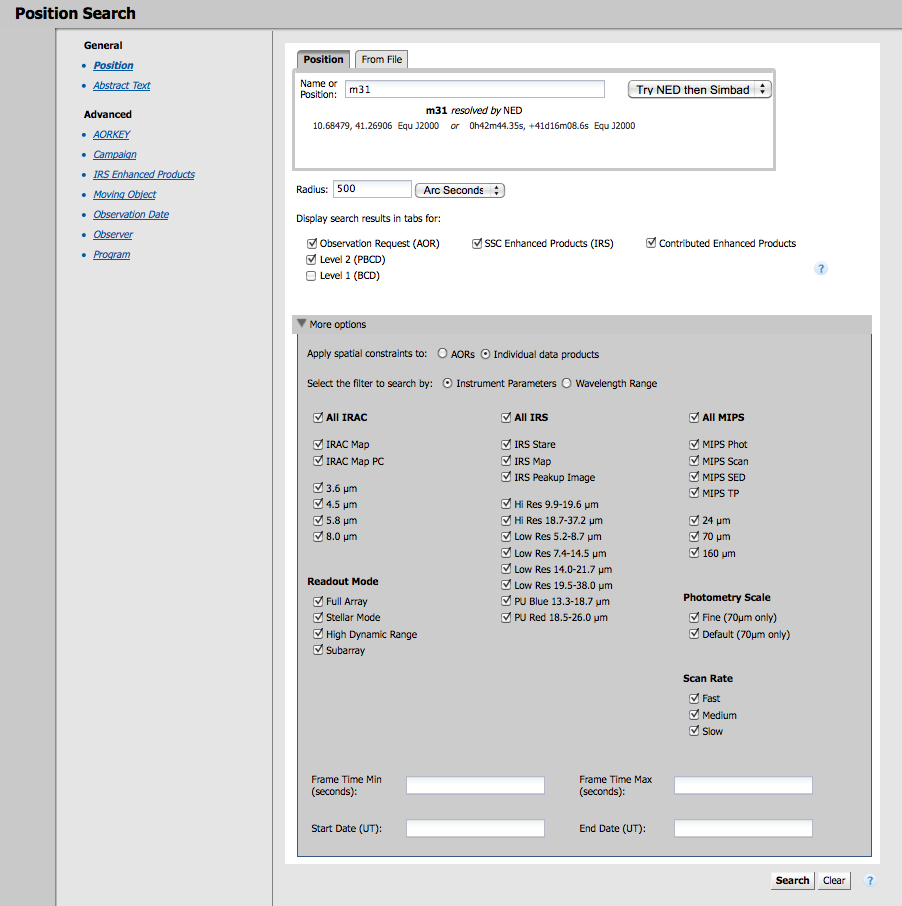
5. Now, again, even from here, it's just fine to hit search. BUT, maybe you want to customize things even further! Click on the little "More options" line to reveal, well, more options:
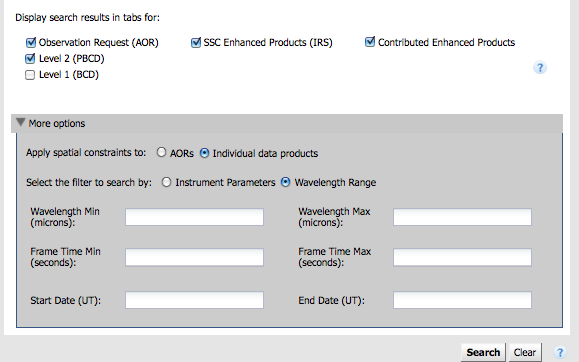
6. Maybe you are only interested in IRAC data? Or just MIPS-24 data? Pick which you want. The default is to return everything. If you want to, e.g., turn off all IRS search results, click on the checkbox next to "All IRS." (And similarly for the other instruments.) If you want to search by wavelength instead (maybe you don't remember which channel is which on IRAC), you can also search by wavelength:
NOW, click "search."
I STOPPED EDITING HERE
2. Go up to the "query" menu in the upper left of the window and search by position or program id or observer to obtain whatever data you want. For example, if you are part of the IC2118 Research Program, you would want to retrieve data for programs 235 and 266. Since the team was not interested in getting IR spectra, the program has just IRAC and MIPS data available for download. Below is an example of what a Leopard query based on observer name (Tim Spuck) will produce.
3. Find the AOR you want in the list of returned AORs. Select it by clicking the box to the left of the Programs you are interested in and press "OK".
4. Select the wavelengths you want, and the kind of data you want. Click on the little diskette icon to begin the download. It will launch something called the "Subscriber" to manage the download. Important!: If you just want the mosaics, just choose the Post-BCD data to download. (If you want to reprocess the data from the beginning, or combine data from more than one AOR, you'll need the BCDs, but this is really not for the faint-of-heart.)
5. Wait for the download to finish. The Leopard subscriber is smart enough to pick up where it leaves of if there is a network hiccup mid-transfer.
6. Unzip the files that Leopard puts on your disk. On Windows or Macs, you should be able to simply double-click on the zip file to make it work. On a linux machine (or from a Mac terminal), this will also work: "unzip P00235-_IRAC_map.zip" etc. for the other files you have downloaded.
7. What are all these files? This is the real thing, not sugar-coated for the average John Q. Public -- it's giving you all of the things you might need as a professional astronomer. So, you need to learn a little about how this works in order to decipher what you've downloaded:
- Cheatsheet for just the post-BCD stuff:
- *maic.fits = the mosaic (MosAIC), e.g., what you are really looking for (probably!)
- *munc.fits = the errors (UNCertanties) on the fluxes in the mosaic (should be larger on the edges, for example)
- *mcov.fits = the coverage (COVerage), e.g., how many frames were taken over each part of the sky. That way, you can see where on the edges we have only one frame
- *maics.fits = for IRAC only, mosaic of just the short exposures (we get a short and a long for each position)
- *muncs.fits = for IRAC only, the errors (UNCertanties) on the fluxes in the mosaic of just the short exposures
- *mcovs.fits = for IRAC only, the coverage of just the short; ought to be identical to the long coverage map.
- *mfilt.fits = for MIPS-70 only, the mosaic of the filtered data (trying to get rid of instrumental artifacts)
- *mfunc.fits = for MIPS-70 only, the errors (UNCertanties) on the fluxes in the filtered mosaic.
- *mfcov.fits = for MIPS-70 only, the coverage in the filtered mosaic; ought to be the same as the original (unfiltered) coverage map.
Visualize AOR using Leopard (optional but useful if truly new at this)
The point of this is to see specifically where the telescope will be/was pointed for a given observation. If you have an observation that is a big mosaic, you can see where each individual pointing fell. This helps you understand why you have so many files when you download Spitzer data.
- From Leopard's main window, select an AOR.
- Under the Images menu, choose ISSA, and select a 5 degree image in the wavelength of your choice (25, 60, 100, 160 microns).
- Under the Overlays menu, choose "AORs on image." (5th from the bottom on the Overlays menu.) Depending on your wavelength, each colored box may result in one or two data frames, each of which is a file you get from Leopard, as well as scads of associated files for each of those frames! (Note that there are lots of other overlay options to explore, and we encourage you to do so, but if you want to see where your observations fall on the sky, you need to pick "AORs on image.")
There is more information on visualization in the Spot and Leopard User's Guides.
Downloading Data: How can I find already-reduced Spitzer data?
Including polished mosaics and source lists!
Downloading Data: How can I find any prior observations for an object?
Has a particular target ever been observed with any of Spitzer's instruments? Or, would this target be a good proposal for a new project?
Downloading Data: How can I quickly get a mosaic of my object?
Get me a mosaic, quick! Don't bother me with preambles or complete explanations, I just want a picture. (Also see What is a mosaic and why should I care?)
Downloading Data: I need the image as a FITS file, how can I get this?
OK, I'm ready for a real fits file that doesn't have any losses due to compression.
Downloading Data: What should I do if there is more than one mosaic of the same object?
What to do if there is more than one imaging observation of your favorite target. Includes an example for finding the best possible image of a target, M16. If you have more than one image of a target that you need to combine, this naturally leads into mosaicking. An example is given for the ONC, including a link explaining how to combine (mosaic) the images.
Downloading Data: How can I get a spectrum of my object?
Spitzer is more than just imaging -- IRS and MIPS take spectra as well as images.
Downloading Data: I'm ready to advance to a highly technical and in-depth discussion on downloading Spitzer data.
This tells you how to start from the same place professional astronomers do. You will have to learn how to mosaic frames using the Spitzer tools developed for professional astronomers by the Spitzer Science Center. This needs a lot of disk space, and, well, a little bit of courage! And access to IDL would help a lot.
Questions to think about and things to try with Spot/Leopard
- This item is easiest to do with Leopard. Pick an object to search on, anything you want.
- Which program(s) (if any) have observations? With which instruments?
- Who requested the observations? (bonus: What are they investigating?)
- Has Spitzer observed it yet?
- When are the data going to be available to download? If they are available, download the post-BCD mosaics.
- Try the questions on this page using Spitzer data for the three color planes.
- This item can be done with Spot or Leopard, perhaps slightly easier with Spot than Leopard. You might find it useful to consult "Using Spot to get data from other wavelengths". For a given object, whether or not you can find Spitzer data, find images of the object from another mission or survey, in another (non-Spitzer) wavelength.
- What wavelength(s) did you pick?
- What features are more apparent in the other wavelength compared to Spitzer? Are there other differences?
- This item can be done with Spot or Leopard, perhaps slightly easier with Spot than Leopard. For a given object, on top of one of those images of an object from another mission or survey, pick a catalog (such as IRAS) to overlay on the image. Figure out how to just have it show the brightest or just the faintest things. Warning: if you choose to overlay the 2mass catalog over a large region, you will be waiting for several minutes while the computer renders many 1000s of points.
- What other catalog(s) at what other wavelength(s) did you pick?
- Were there a lot of sources in the region you picked, in the catalog you picked? Why? (You may wish to pick another catalog for comparison.)
Come up with your own answers and then discuss downloading data.


