I need a sinusoidal light curve to play with
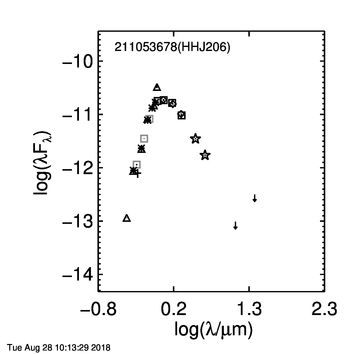
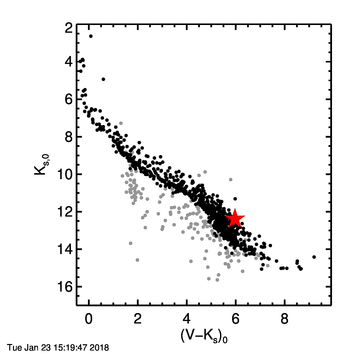
I've had requests for a sinusoidal light curve to play with. I’ve attached the K2 light curve from HHJ206 (known also as EPIC 211053678), which is located at 034316.59+235001.6. It’s ~140 pc away. It’s an M star. I’ve also attached a color-magnitude diagram (black is Pleiades member with a K2 light curve, grey is likely non-member, red star is this one) and an SED (I can give you all the symbol definitions if you really want, but it’s sdss u through wise 2 detections, with limits in w3w4. I’m also attaching a plot of the light curve, its power spectrum, and the phased light curve. The data file has time (bjd), flux, and already has all questionable points dropped, so it is unevenly spaced in time. This star most likely has a big spot or spot group rotating into and out of view, hence the sinusoidal light curve. I get P= 0.77027 days. Oh, and note that there are only really upward excursions. Those are flares. There’s one relatively big flare at about 50 days into the campaign.
This tool: https://irsa.ipac.caltech.edu/irsaviewer/timeseries will let you do a Lomb-Scargle periodogram.


