Talk:Making Light Curves for our YSO Candidates
Contents
- 1 TUTORIAL QUESTIONS
- 2 practice light curve data
- 3 practice light curve ....
- 4 Location of image files for practice light curve ....
- 5 X,Y postion of YSO targets and REF objects in images ....
- 6 11-27-17_1333EST
- 7 Practice Light Curve and Loop Problem
- 8 Matt's Light Curve using Beth Thomas's Method
- 9 Practice curve
- 10 Light Curve Correction
- 11 Nick's Project
TUTORIAL QUESTIONS
X-Dani-
1) is it giong to be interactive or informational?
   a) are people going to be able to "plug in" the information and it's going to spit out a light curve?
  b) is it just going to be a "follow along paper" telling them how to do it step by step?
practice light curve data
....DANIELLEYEAGER.. 11/15/2007_23:55EST
Would you like our practice light curves posted on here? If so, do you want our entire spread sheets as well as the graph; or just one or the other?........
RESPONSE: Dani, yes if you can post them here that would be great. Thanks, Mr. Spuck
practice light curve ....
........DANIELLEYEAGER.... 11/19/07 15:11EST
today during 7th period mr.spuck pulled the IC2118 group aside and discussed how far we had gotten with the practice light curve and the wiki.
i am almost done with my light curve. i used the HOU [hands on universe] program to collect my data. fast and easy. However, there were only 4 constants in the images, two of which being my targets. once I create the spread sheets along with the graph, I will try to find a way to get them on here along with a step by step on how I did it.
15:22EST
mr.spuck saved a file into the practice folder showing 13 reference points, he also posted them on the wiki in section 17 of the discussion. i'm going to have to go back into my data and force HOU to spit out that information.
[END]
Location of image files for practice light curve ....
........Spuck.... 11/19/07 15:30EST All image files are locatde here: http://web.ipac.caltech.edu/staff/rebull/ic2118/monitoring/
X,Y postion of YSO targets and REF objects in images ....
........Spuck.... 11/19/07 15:30EST
Using MaxIm DL or Hands On Universe Image Processing Software
These are the image coordinates for the two YSO targets and 13 common reference objects in the practice light curve data set.
X Y
YSO 1: 176, 182 +/- 3 pixels
YSO 2: 179, 144 +/- 3 pixels
REF 1: 52, 436 +/- 3 pixels
REF 2: 94, 124 +/- 3 pixels
REF 3: 99, 222 +/- 3 pixels
REF 4: 129, 399 +/- 3 pixels
REF 5: 131, 309 +/- 3 pixels
REF 6: 156, 23 +/- 3 pixels
REF 7: 164, 286 +/- 3 pixels
REF 8: 201, 35 +/- 3 pixels
REF 9: 213, 295 +/- 3 pixels
REF 10: 220, 304 +/- 3 pixels
REF 11: 290, 36 +/- 3 pixels
REF 12: 379, 449 +/- 3 pixels
REF 13: 428, 359 +/- 3 pixels
11-27-17_1333EST
.............DANIELLEYEAGER.....
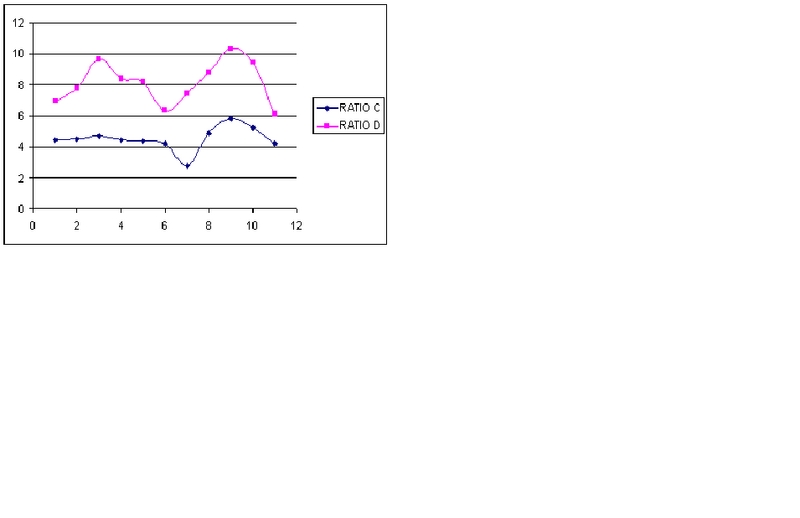
FIRST ATTEMPT AT POSTING PRACTICE LIGHT CURVE.
note... to load in picture, must upload file to wiki then recall.
data table
DATE------------------A------B-------C-------D----RATIO--RATIO C--RATIO D
03-13-0803-002...818..1510..5207..8083...1164......4.47.......6.94
03-13-0803-001...869..1429..5144..8316...1149......4.48.......7.76
03-09-0848-001...760..2853..8800..17440..1806.5....4.73.......9.65
03-09-0844-001...727..1024..3927..7418...884.5.....4.44.......8.39
03-09-0806-001...976..911...4144..7703...943.5.....4.39.......8.16
03-16-0803-001..1271..1179..5153..7797...1225......4.21.......6.36
03-15-0810-002..1046..1340..3302..8867...1193......2.77.......7.43
03-14-0800-003..1721..2731..10831..19584..2226......4.87......8.8
03-14-0800-002..1028..700...5026...8916...864.......5.82.....10.32
03-14-0800-001..1158..658...4760...8565...908.......5.24......9.43
03-13-0803-003...942..1634..5424...7877...1288......4.21......6.12
revised data table
DATE----------------RATIO C-----RATIO D
03-13-0803-002----- 4.47----- 6.94
03-13-0803-001----- 4.48----- 7.76
03-09-0848-001----- 4.73----- 9.65
03-09-0844-001----- 4.44----- 8.39
03-09-0806-001----- 4.39----- 8.16
03-16-0803-001----- 4.21----- 6.36
03-15-0810-002----- 2.77----- 7.43
03-14-0800-003----- 4.87----- 8.8
03-14-0800-002----- 5.82----- 10.32
03-14-0800-001----- 5.24----- 9.43
03-13-0803-003----- 4.21----- 6.12
GRAPH IS IMAGE LOADED INTO PHOTOBUCKET.COM AND THEN SAVED TO THE WIKI AS GRAPH.JPG.... THIS IS THE ONLY SOLUTION I COULD COME UP WITH AS TO POSTING A PICTURE OF THE GRAPH. ANY IDEAS OR OTHER OPTIONS??
.......11/30/07 1017est......... okay, so I made a really REALLY beginner mistake and completly forgot about the fact that I had to use julian date. SOOO.. I will post a new thread with the updated information.
.....11/30/07 1042EST.............. i guess it's just a day for mistakes. i was using the file image name rather than the date and time from the header. so, i have to do the dates over again AND THEN convert into julian time. [END OF DANIELLEYEAGER POST]
--Spuck 10:45, 4 December 2007 (PST) Dani, when you write ratio C and ratio D, what do you mean? You are dividing what by what? Also, did you follow the directions from the activity we are working showing you how to generate a light curve. In the activity one of the things you are asked to do is convert to Julian time.
--Dani 10:49, 4 December 2007 (PST) TSpuck, Ratio C means the Candidate C divided by the average of the references. Ratio D means the Candidate D divided by the average of the references. And no, I did not use the activity worksheet. [end]
Practice Light Curve and Loop Problem
..............DANIELLEYEAGER 11/30/07 1336EST
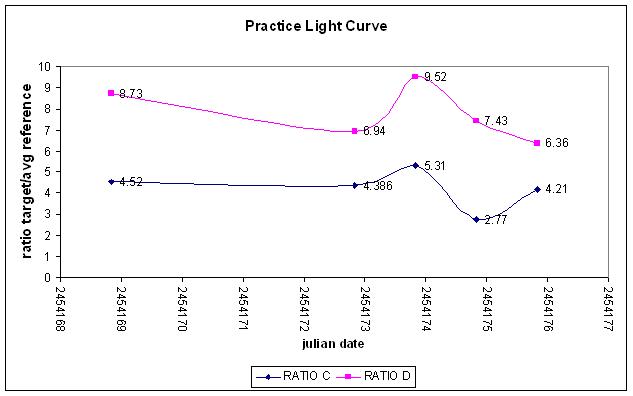
After figuring the Julian Date for the data, the light curve started to loop. By loop, I mean that the dates stacked fairly close to right above one another and circled through them forming a loop. By this loop problem, I've made the assumption that if a set of data has several points that are seconds or minutes apart, the data will loop. To solve the loop problem I averaged together the points that formed the loop and had that as my point. Doing so decreased my data points severely, but did work in achieving my desired goal.
NOTE .... when uploading pictures make sure to use EXACT title. example.. if the file name is uploaded as graph2.JPG you must type exactly, example capatalizing the JPG.
NEW DATA TABLE AND GRAPH
JULIAN DATE..... RATIO C..... RATIO D
2454168.838........ 4.52............ 8.73
2454172.835........ 4.386...........6.94
2454173.833........ 5.31............ 9.52
2454174.84.......... 2.77............ 7.43
2454175.835........ 4.21............ 6.36
--Spuck 11:03, 4 December 2007 (PST) Dani, Can you double check the last two data points on your graph (2454174.84 and 2454175.835)? The curves seem to match up except for one of these two sets.
Also, does anyone know how to set up a graph in excel so that you only connect some of the data points being graphed? Thanks.
[END OF DANIELLYEAGER POST]
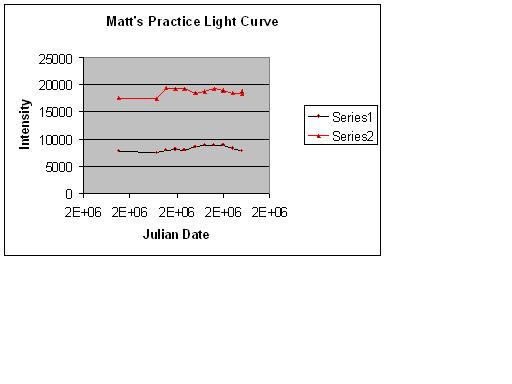
Matt's Light Curve using Beth Thomas's Method
HJD YSO 1 in R YSO 1 in I
2454168.838______7703________17560
2454172.833______7418________17440
2454174.844______8038________19293
2454175.835______7869________19316
2454177 856______8565________18534
2454178 8820_____8820________19204
2454179 8820_____8820________18871
2454180 8820_____8258________18534
2454181 8258_____7820________18310
2454182 7820_____7708________18729
Practice curve
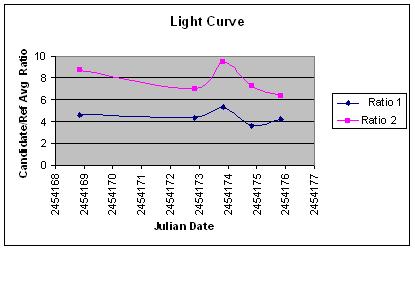
Nick's light curve, 12/04/07 1:34
Julian Date    Ratio 1 Ratio 2
2454172.835	4.4	7
2454173.833	5.3	9.5
2454174.843	3.6	7.2
2454175.835	4.2	6.4
Once again Perth is down.
--Spuck 11:39, 4 December 2007 (PST) Nick, Perth will probably be down for a bit. See my previous post to Dani. Also, your light curve looks similar to Dani's. That's good and bad. :) Can you check with Dani and answer the following question for me and then post your responses:
1. Did the two of you use all the same reference stars?
2. Did the two of you use the same software to get the brightness values for your reference stars and YSO candidates?
Also, I'd like to se you modify your graph a bit. Label the Y axis more clearly (don't just say ratio ... ratio of what?). Also, turn the julian dates (ie. like I had Dani do hers). And use the scatter plot with the line connecting the data points. Also correct your spelling error in the graph title. Thanks.
--Nicholas 10:36, 6 December 2007 (PST) Well Mr. Spuck Dani walked me through what to do with the Light Curve so it would be understandable why our light curves would be similar. [end]
--DanielleYeager 09:59, 7 December 2007 (PST) 1.) I don't know if we used the same reference stars, but I do know that he used MORE reference stars than I did.
2.) I used HOU.
Light Curve Correction
--DanielleYeager 10:44, 7 December 2007 (PST) In study of both Nick's and my own light curve, we have discovered why the peaks are not matching up. The graphs show two different candidates rather than two different filters for the same candidate. Both light curves need redone, focusing on one candidate in both the I and the R filters. Each graph needs to show the I and R light curve for one candidate. [end]
Nick's Project
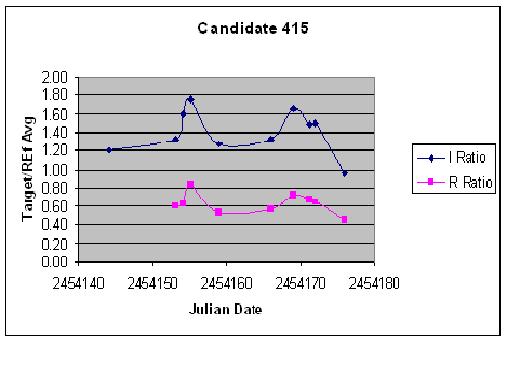
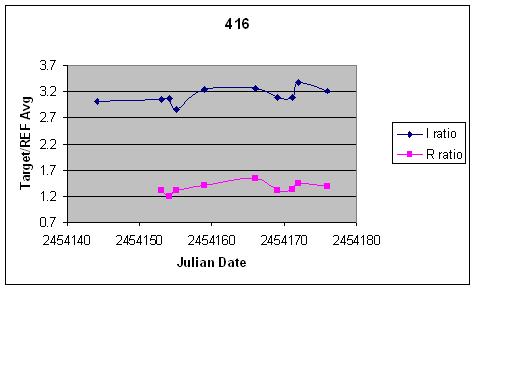
--NicholasJamesKelley 10:17, 11 December 2007 (PST)This area will be used to show the current progress I am making toward proving that Candidates 415 and 416 are T-Tauri Stars.
--NicholasJamesKelley 10:47, 7 December 2007 (PST) These are my light curves for the 2 candidates that I am monitoring for Spitzer and the Sceince fair. I am currently monitoring to get more accurate curves to take with me.
Candidate
415	Julian Date	I Ratio	R Ratio
12-Feb	2454144.168	1.20
21-Feb	2454153.051	1.32	0.6
22-Feb	2454154.144	1.6	0.63
23-Feb	2454155.121	1.76	0.84
27-Feb	2454158.9	1.27	0.53
6-Mar	2454166.035	1.33	0.56
9-Mar	2454169.047	1.66	0.73
11-Mar	2454171.074	1.49	0.68
12-Mar	2454172.013	1.5	0.65
16-Mar	2454176.01	0.96	0.45
Candidate
416	Julian Date	I ratio	R ratio
12-Feb	2454144.168	3
21-Feb	2454153.051	3.04	1.3
22-Feb	2454154.144	3.06	1.19
23-Feb	2454155.121	2.86	1.31
27-Feb	2454158.9	3.24	1.4
6-Mar	2454166.035	3.26	1.52
9-Mar	2454169.047	3.07	1.31
11-Mar	2454171.074	3.07	1.33
12-Mar	2454172.013	3.36	1.44
16-Mar	2454176.01	3.2	1.38
