Using the SHA, long version
Contents
Simplest Search
1. Go to the SHA: http://irsa.ipac.caltech.edu/applications/Spitzer/SHA/
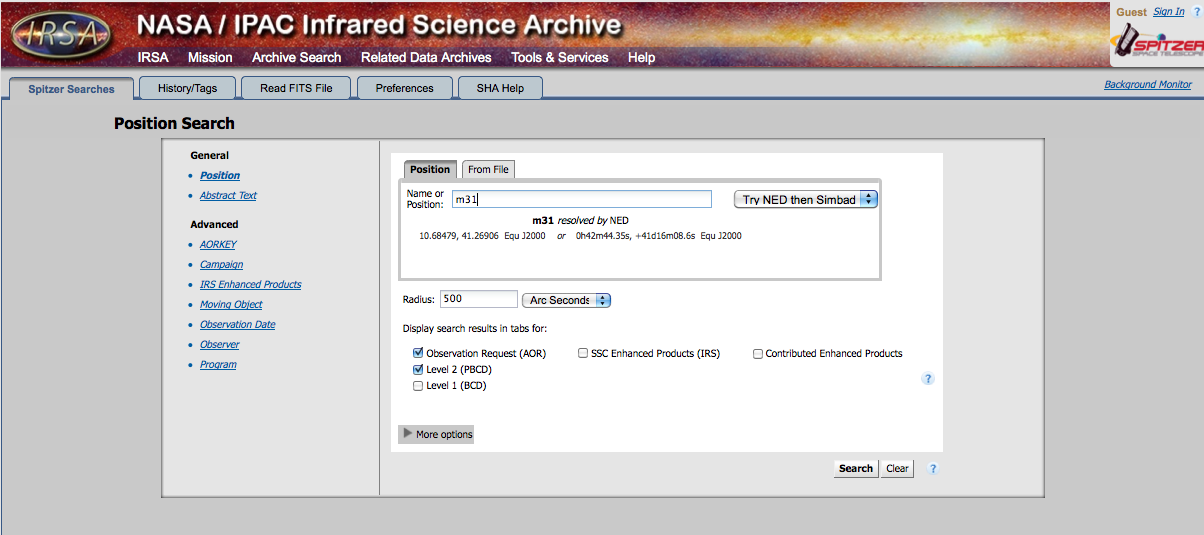
2. You are dropped into a "postion search." (There are other search options on the left.) Type in the name of an object you care about. The machine will automatically resolve the name, e.g., turn the name into coordinates. You can choose which service does this name resolution - NED or SIMBAD. If you have something extragalactic, NED is better; if you have something else, SIMBAD works better. You can also type in coordinates directly. In any case, it tells you right below the box exactly what position it thinks you've entered, so you can check that it's doing exactly what you want it to do.
3. Now, really, you can just hit search, and you can investigate the search results.
Refining your search
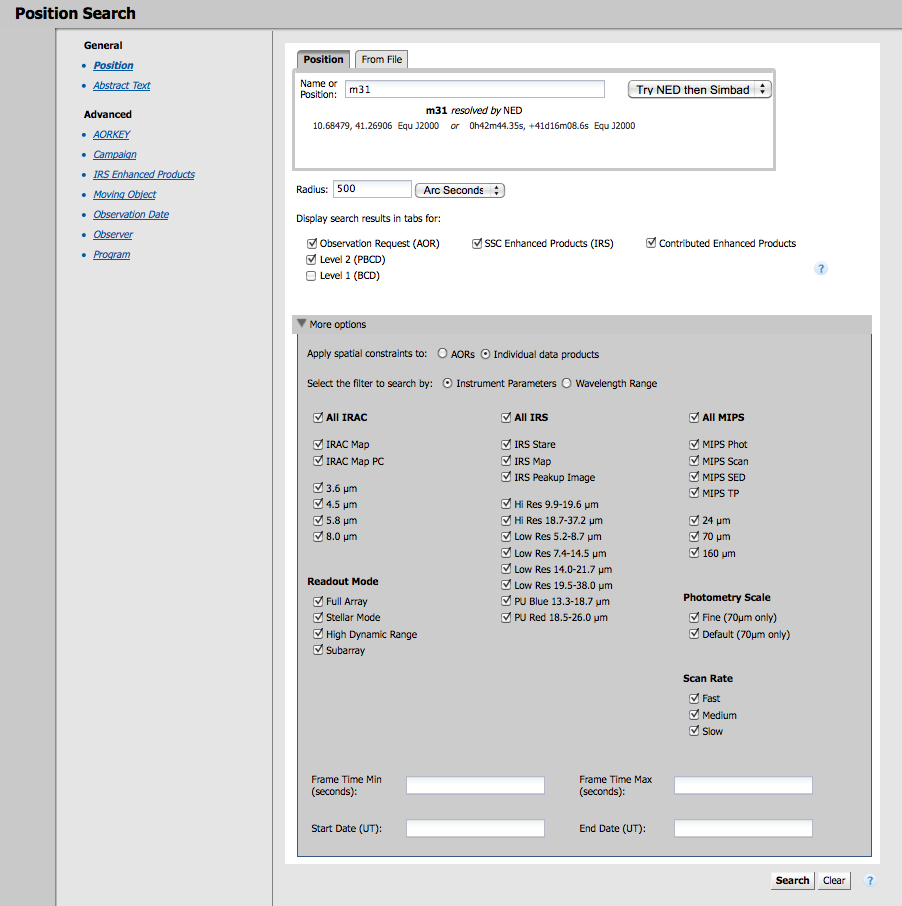
4. Maybe you want to customize things further. There are several additional options, as seen in the box above:
- search radius -- change the units, type in the number you want.
- apply spatial constraints -- do you want it to return whole AORs, or just the region within your search radius?
- display search results -- which data products do you want? That's important. Let me repeat that, in bold: which data products do you want? Look above, under "Basic Terminology." In all likelihood, you want the AORs and the Level 2 (post-BCD) data, but you should also look for enhanced products, since those may save you quite a bit of data reduction time. You can also check Level 1 (BCD) if you want to start from the beginning and reduce the data yourself.
5. Now, again, even from here, it's just fine to hit search. BUT, maybe you want to customize things even further! Click on the little "More options" line to reveal, well, more options:
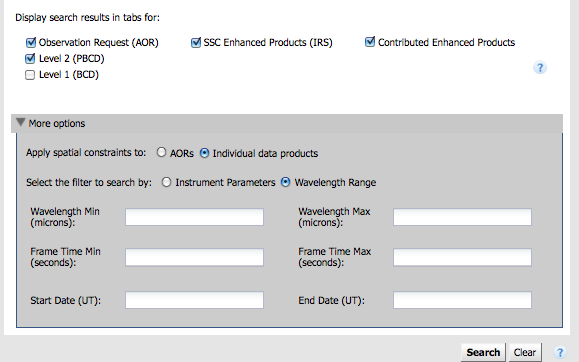
6. Maybe you are only interested in IRAC data? Or just MIPS-24 data? Pick which you want. The default is to return everything. If you want to, e.g., turn off all IRS search results, click on the checkbox next to "All IRS." (And similarly for the other instruments.) If you want to search by wavelength instead (maybe you don't remember which channel is which on IRAC), you can also search by wavelength:
7. NOW, click "search."
Understanding your results -- the anatomy of the search results page
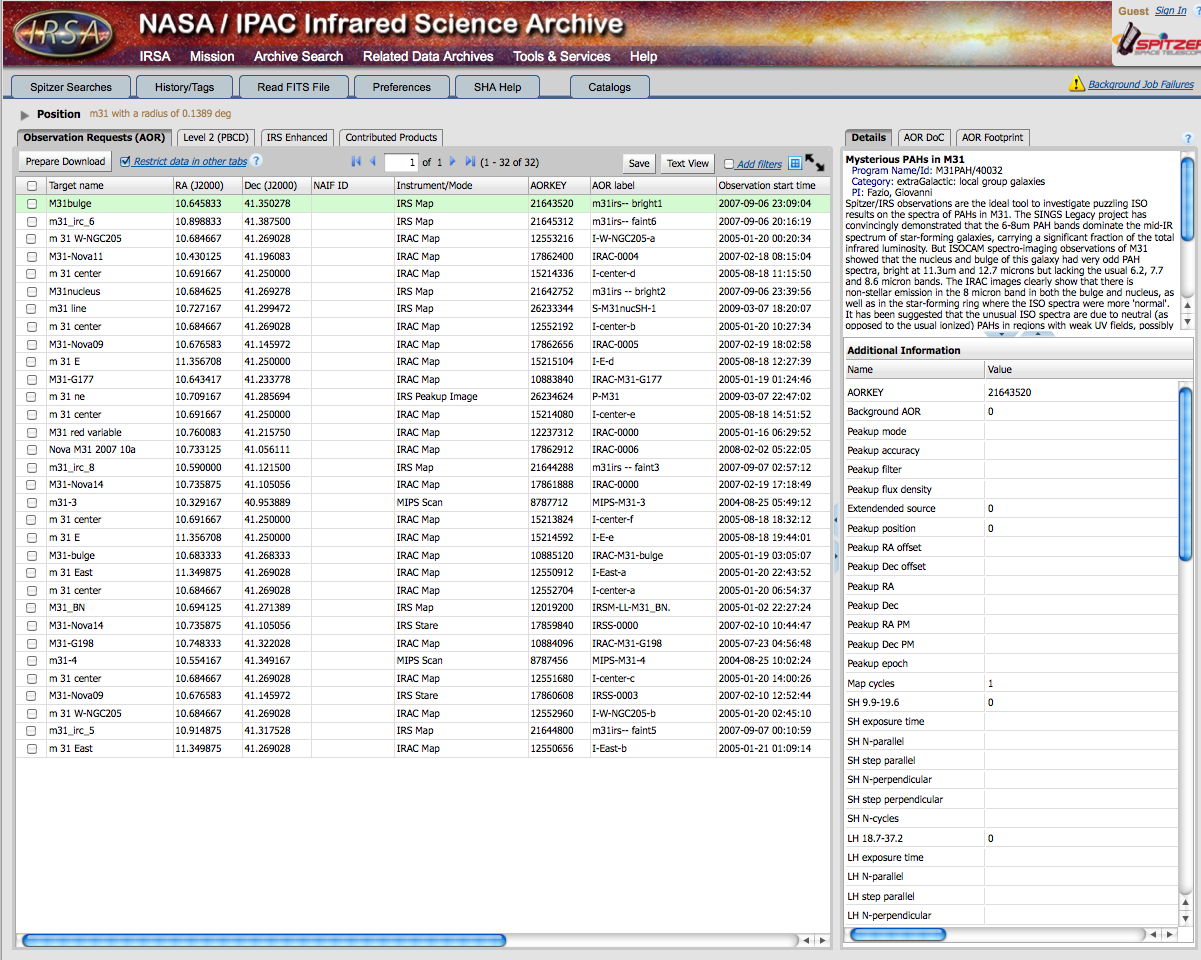
This is what I see after a generic search for all M31 data:
Let's examine the anatomy of this page.
The online help is on the top right, at the end of the red menu bar. Pick 'Spitzer help' for the right help. There's an option there for K-12 teachers and NITARP, but right now it just points back to our pages about NITARP, not more information specifically targeted at you guys. Sorry!
Your search pane has collapsed into the blue tab at the top. To search again, click on the blue "Spitzer Searches" tab, and it will reappear.
The main part of this window is your search results.
On the left there are individual itemized results. On the right is the "Details Pane", the contents of which changes according to what you have selected in the individual itemized results (e.g, which row is green). There are several tabs here too in the details pane, and again, these tabs change depending on what you are looking at in the itemized results.
On the left pane are several tabs in my example, but the number and content of tabs corresponds to what you have selected for your download. Here are my tabs:
I have tabs that read: "Observation Requests (AOR)" (for nomenclature, see above), "Level 2 (PBCD)" (PBCD=Post-Basic Data Products -- products that come from combining individual frames, e.g., mosaics). I could have also selected "Level 1 (BCD)" data to be returned. For my search here, I also have two "enhanced product" tabs - "IRS Enhanced" (these are from spectra, and delivered by the IRS team), and "Contributed Products" (these are images -- not just in Spitzer bands -- catalogs, and spectra delivered back to us by various teams, largely Legacy teams).
AOR Tab
As NITARP users, your first stop should be the AOR tab, because this is a high-level summary of the observations. After you pick which observations you want, then you want the Level 2 tab to get the mosaics (and associated files). Even professional astronomers should start with the AOR tab. Because each AOR can result in many, many files, this AOR tab really is the best place to start browsing!
Column Headings in the AOR window are:
- The target name was supplied by the original observer and may be clear or it may be cryptic.
- The RA and Dec are the target of the AOR as observed.
- If the object was observed as a moving target, the NAIF ID is listed; otherwise, this is blank.
- The instrument and observing mode are listed next.
- The AORKEY is a large integer that uniquely identifies this observation in the SHA.
- The AOR label was supplied by the original observer and may be clear or it may be cryptic.
- The Observation start time is the time, in UT, that the observation was begun.
- The Program ID is the integer identifier for the program under which these observations were obtained.
- The Principal Investigator (PI) for these data is listed last in the default display.
- An additional column can be added which indicates whether the observation was an AOR or an IER. (click on the little grid-like button at the top right of the tab window to do this.)
Restricting data in other tabs: By default, the search results come up with all returned AORs in the AOR tab and all corresponding files -- and there are many -- for ALL of the AORs in the other tabs (Level 1 and Level 2). If you want to limit exactly which files appear in the Level 1 and Level 2 tabs, check the "Restrict data in other tabs" box and then check the box in the AOR row you want to examine. Then, the only files that will appear in the Level 1 and/or 2 tabs will be those files corresponding to that AOR.
Note that, like a big search on a commercial site, you may have more rows than it is showing you. Look at the bottom of your main search results window. "Page Size" tells you how many rows it shows per page. Increase this number to see more at once. Do you have too many rows? Further restrict the search by imposing additional filtering; see below!
Level 1 (BCD) tab
(The individual data frames that emerge [calibrated] from the Spitzer pipeline are Level 1, or Basic Calibrated Data, or BCDs. )
Each AOR that was returned by your search can result in hundreds, sometimes thousands, of files. This Level 1 (BCD) tab contains all of the BCDs and associated files (e.g., masks) that correspond to the AORs returned (or selected) in the AOR tab.
Column Headings:
- The AORKEY is a large integer that uniquely identifies this observation in the SHA. (Note that each AOR results in many files, and that you can restrict the contents of this tab to be just those files corresponding to one AOR; see "Restricting data in other tabs" above.)
- The BCD ID is a large integer that uniquely identifies this particular file in the SHA.
- The instrument and observing mode are listed next.
- The specific bandpass of this individual file is in the next column.
- The RA and Dec are listed in hh:mm:ss dd:mm:ss format. If "no data" or other unusual values appear here, this is most likely a calibration file.
- The exposure time corresponding to this file is given in seconds.
- Particularly in the case of MIPS, the arrays may be on and collecting data even if the telescope is being used to observe using one of the other fields of view in the instrument. For any given row, if the telescope was optimized for use of the field of view to which the specific file applies, then the "primary field" column is 1; other values indicate that this is serendipitous data. See the MIPS portion of the SSC website for more information on how to use these data.
- Since there can be files at the BCD level that are not images (such as tables of data), the "File Type" column lists the nature of the file. "Image" will be the most common.
- The file name of the corresponding file once it is unpacked and resident on your disk is listed. The filename contains information about the instrument, channel, and originating AOR as well as the specific contents of the file; see the SSC website for a comprehensive listing of the files available at the BCD level (Level 1).
- Several additional columns can be added to the BCD view. Most of these should be self-explanatory from the column headers (or the tool tips) appearing in the pop-up window that appears when you add columns (see more information on options found in every tab -- in brief, click on the little grid-like icon at the top right of the tab window).
Level 2 (PBCD) Tab
(The products that come from combining these individual data frames [such as mosaics of individual pointings] are Level 2, or post-BCD, or PBCD data.)
Column Headings:
- The AORKEY is a large integer that uniquely identifies this observation in the SHA. (Note that each AOR results in many files, and that you can restrict the contents of this tab to be just those files corresponding to one AOR; see "Restricting data in other tabs" above.)
- The instrument and observing mode are listed next.
- The specific bandpass of this individual file is in the next column.
- The RA and Dec are listed in hh:mm:ss dd:mm:ss format; in a future version, you will be able to convert these to decimal degrees. If "no data" or other unusual values appear here, this is most likely a calibration file.
- Since there can be files at the BCD level that are not images (such as tables of data), the "File Type" column lists the nature of the file. "Image" will be the most common.
- The file name of the corresponding file once it is unpacked and resident on your disk is listed. The filename contains information about the instrument, channel, and originating AOR as well as the specific contents of the file; see the SSC website for a comprehensive listing of the files available at the PBCD level (Level 2).
- Several additional columns can be added to the PBCD view. Most of these should be self-explanatory from the column headers (or the tool tips) appearing in the pop-up window that appears when you add columns (see more information on options found in every tab -- in brief, click on the little grid-like icon at the top right of the tab window).
IRS Enhanced Tab
These are spectra and calculated photometry for objects observed by the IRS in certain modes. These products were generated by the IRS team here at the SSC.
Contributed Products
These are a wide variety of products delivered back to the SSC and IRSA by various investigators. It can include images (big, small, and non-Spitzer bands), catalogs (just Spitzer and beyond Spitzer), and spectra. You can sort and explore these products, if your search returned any, in a variety of ways.
Filtering -- Imposing additional filters to get the most out of your search results
Even if your search returned only one AOR, you could have literally hundreds to thousands of files that appear in the Level 2 (PBCD) or Level 1 (BCD) tabs. In order to quickly weed through what files appear in the tab and examine the file you care about, filters are a very powerful tool.
Click on "Add filters" in order to add a new filter. Each of your current columns can be selected in a pulldown menu, as well as an operation (=, <, etc). If you select a field with a limited set of choices, an additional pulldown appears with those limited choices.
For example, if you have searched on an IRAC AOR and would like to only view the files relevant to the 3.6 micron channel, select 'Bandpass', '=', and 'IRAC 3.6 um' from the relevant pulldowns, then "ADD" the filter and "APPLY" it to your search results. Then, the number of files is limited, and the notice on the top right of the search results pane reminds you that there has been a filter applied.
You can add additional filters to further restrict your list of files.
NOTE THAT the filters as imposed this way only apply to your current tab, even if "restrict data in other tabs" is selected! (See "Restricting data in other tabs" above for more information on this option -- in summary, restricting data in other tabs means selecting the checkbox for a row of the table and seeing the files corresponding to that row in the other tabs, whereas filtering corresponds to the values in the columns.)
Details pane
As you are moving around and selecting observations out of the search results, you may notice that the contents of the details pane change. You can click and drag to resize window panes or column edges. You can find:
- information about the AOR, such as original program title, program name, primary science category, principal investigator, and abstract. You can use this information to understand what the original observer was trying to achieve with these observations -- e.g. if they were attempting to observe bright things, it is unlikely that you will be able to use those observations alone to study faint things.
- technical information about the observation, such as the AORKEY (a large integer that uniquely identifies this observation in the SHA) and the observing mode parameters that defined this observation (such as frame time and dither pattern). More information about these parameters and their available values for any given instrument or mode can be found at the SSC website.
- the footprint of the observation, e.g., the specific region of sky that was covered by the selected observations. The background image that comes up by default is automatically selected (you can change it), and the outline of the observation (its "footprint") is drawn on the image.
- information about a specific file.
- the actual data in the file you are investigating.
Downloading and Unpacking Data
After deciding what data to download, click the checkboxes to pick specific data files to download, and then click "Prepare Download" to begin the packaging and downloading process. A pop-up window will appear in order to define exactly what kinds of data you would like to have packaged up. Clicking OK initializes this process.
After you click ok, the packaging process is spun into the Background Monitor. This Background Monitor can be called up by selecting the "Background Monitor" link from the upper right at any time. You can watch your data being packaged, and when the data are available for download, it will update that window, providing a link for downloading the packaged data. Click the link to download the data. Your computer should know what to do with it, but it may place it in a "Downloads" folder.
Unzip the files. On Windows or Macs, you should be able to simply double-click on the zip file to make it work. On a linux machine (or from a Mac terminal), this will also work: "unzip P00235-_IRAC_map.zip" etc. for the other files you have downloaded.
Contents of your download
What are all these files? This is the real thing, not sugar-coated for the average John Q. Public -- it's giving you all of the things you might need as a professional astronomer. So, you need to learn a little about how this works in order to decipher what you've downloaded:
- Cheatsheet for just the post-BCD stuff:
- *maic.fits = the mosaic (MosAIC), e.g., what you are really looking for (probably!)
- *munc.fits = the errors (UNCertanties) on the fluxes in the mosaic (should be larger on the edges, for example)
- *mcov.fits = the coverage (COVerage), e.g., how many frames were taken over each part of the sky. That way, you can see where on the edges we have only one frame
- *maics.fits = for IRAC only, mosaic of just the short exposures (we get a short and a long for each position)
- *muncs.fits = for IRAC only, the errors (UNCertanties) on the fluxes in the mosaic of just the short exposures
- *mcovs.fits = for IRAC only, the coverage of just the short; ought to be identical to the long coverage map.
- *mfilt.fits = for MIPS-70 only, the mosaic of the filtered data (trying to get rid of instrumental artifacts)
- *mfunc.fits = for MIPS-70 only, the errors (UNCertanties) on the fluxes in the filtered mosaic.
- *mfcov.fits = for MIPS-70 only, the coverage in the filtered mosaic; ought to be the same as the original (unfiltered) coverage map.


