Classifying variables in the Kepler data set
Based on materials originally developed by Peter Plavchan (NStED/IPAC) for the 2010 Sagan Exoplanet Workshop. This group project was entitled "Identifying and Classifying Variables in the Kepler Data Set."
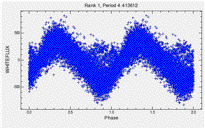
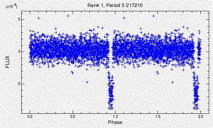
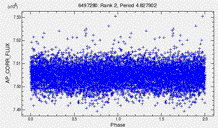
Every star has a story, told by its light curve. How do you listen to 150,000 stories at the same time? How can you (easily and accurately) tell which stories are interesting? In the figures below, one is a transit, one is noise, and one is indicative of stellar rotation, but they all have similar statistical properties. How can you tell without looking at each one by hand?
The goals for this exercise are to learn about variability statistics, periodograms, machine learning classification schemes, and the utility of ancillary information.


