Confusion
Introduction
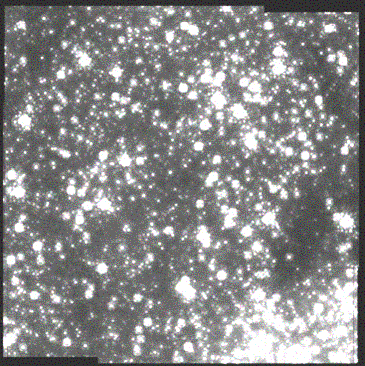
The term "confusion-limited" refers to images in which there are so many detected sources that distinguishing individual objects is difficult. In a confusion-limited image, the spatial structure of the background resembles the superposition of many point sources. In the optical, the confusion limit is not often encountered, but can be reached in dense star clusters (e.g., in the image shown below). At near-infrared wavelengths, the background is usually dominated by emission from partially-resolved and unresolved stars or distant galaxies. In the mid- and far-IR, the background can also contain a contribution from Galactic "cirrus" emission. In an image that is near or at the confusion limit, determining whether a particular faint source is part of the background or is a target can be difficult.
The structure of the background effectively increases its noise contribution above what would be calculated based on the flux contributed by all of the sources in a region. The structure contributes directly to the variance of the background as it would be measured by aperture or PSF-fitting photometry extraction software, for example.
The kinds of confusion observers need to worry about depends on the science goals of the observation. The confusion noise will be different if one wants to extract photometry of sources in an unbiased survey, rather than measuring a source that is known to exist at shorter wavelengths. For example, when the observer has a priori knowledge of a source position, in some cases it may be possible to integrate somewhat below the confusion limit to obtain photometry of that object. The presence of a nearby bright source, with its associated diffraction artifacts, will raise the effective confusion limit. Moving targets offer the possibility of making a second, so-called "shadow" observation, which allows the suppression of confusing sources by subtracting them away.
The degree of confusion depends on the wavelength of the observation because of optical properties (PSF, etc) and also galaxy density and their spectral energy distributions (SEDs), the Galactic cirrus SED and structure, etc. This is not an "easy" computation, which is why firm confusion predictions for Spitzer are so difficult; see below.
By studying the fluctuations (variations in brightness) from one patch of sky to the next, we may be able to learn more about the most distant galaxies (or stars). Power spectrum analysis (meaning studying mathematically how the brightness varies with size of the patch on the sky) can be used to quantify the fluctuations.
 This image is an example of a confused field from NICMOS observations near the Galactic Center.