Photometry Scaffolding
By Dr. Luisa Rebull, version 1, 19 Dec 2019, for Olivia and Tom
Attempting to work through this scaffolding (after some preliminaries):
- How it works for a single isolated point source, aperture
- How it works for a single isolated point source, PSF fitting
- How it works for many point sources, each of which are isolated, but with a variety of brightnesses, aperture
- How it works for many point sources, each of which are isolated, but with a variety of brightnesses, PSF fitting
- How it works for a single point source with variable background, aperture
- How it works for a single point source with variable background, PSF fitting
- How it works for a collection of isolated point sources with variable background, aperture
- How it works for a collection of isolated point sources with variable background, PSF fitting
- How it works for a clump of sources very close to each other, aperture
- How it works for a clump of sources very close to each other, PSF fitting
Many of the hiccups you are having may be coming from the fact that, by eye, you can see the sources *there* so what is the issue, but the gap in understanding has to do with explaining that to the computer in terms it can understand and mathematically reproduce identically each time.
Some web research (and consultations with other NITARP alumni) suggests that photometry resources on the web fall into two categories (1) overly simplified for basic concepts, or (2) throw you to the wolves in the context of masters’ or PhD work; figure it out on your own, buddy. So you’ve fallen in this legitimately present gap (crevasse?). I am not saying this is worth sharing with anyone else, or even maybe that helpful here, but here’s a go at filling that gap.
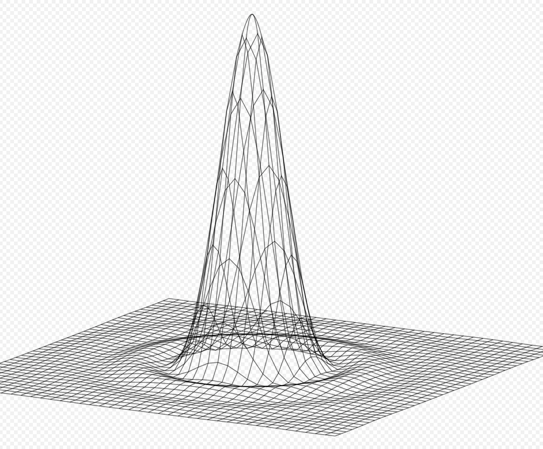
Key concept #1 – for a given image at a given time from a given telescope, at a given location on the chip, the PSF is the same for all sources, of all brightnesses, in the image. The telescope responds the same way to a point source of light regardless if it is bright or faint. For faint sources, you see just the peak of the function; for bright sources, you see lots more details, but it is the same shape as for faint sources.
- Ground-based, non-AO data are probably the same over the chip for a given exposure; if you’re lucky, it’s the same shape over the whole night, but if the weather changes, it’s not. Forget it being the same over a whole run.
- Ground-based, AO data are ~idealized but only over a tiny area on the chip. (one source at a time)
- Space-based data tend to be very, very stable, unless (and sometimes even though) the satellite heats/cools each orbit (e.g., HST). Usually diffraction-limited (Airy functions apparent).
- X-ray data tend to have a spatially-dependent PSF, e.g., the point sources on the edges are more elongated, and the point sources in the middle are more circular.
 PSFs – all of them – start as Airy functions, because physics. Atmosphere may smear them out. Pixels may be so big as to only “see” the highest part of it. Lots of additional effects may matter. Ex: Struts holding the secondary may cause additional diffraction.