Difference between revisions of "Variability of the Mid-IR Sky Current Research Activities"
| Line 16: | Line 16: | ||
[[File:test stars comp.jpg]] | [[File:test stars comp.jpg]] | ||
| + | == Standard Deviation for Dummies == | ||
| + | |||
| + | Our Astronomers said it would be important for us to understand standard deviation. We found the button on Excel that calculates it for us, but doesn't really explain what it is. Here's an explanation and example. | ||
| + | |||
| + | Standard deviation is a statistical measure of spread or variability. The standard deviation is tells you how closely the data are clustered around the average. We want to use the aperture and background subtraction settings that give us the smallest standard deviation for a star that is not varying. Our varying stars will of course have large standard deviations because they ARE varying. | ||
| + | |||
| + | Formula: [[image:stddev.jpg]] | ||
| + | |||
| + | Standard Deviation | ||
| + | standard deviation formula | ||
| + | |||
| + | where Σ = Sum of | ||
| + | X = Individual score | ||
| + | M = Mean (average) of all scores | ||
| + | N = Sample size (Number of scores) | ||
| + | |||
| + | |||
| + | Standard Deviation Method1 Example: To find the Standard deviation of 1,2,3,4,5. | ||
| + | |||
| + | Step 1: Calculate the mean (average) and deviation. | ||
| + | X M (X-M) (X-M)2 | ||
| + | 3 2 1 1 | ||
| + | 2 2 0 0 | ||
| + | 1 2 -1 1 | ||
| + | 1 2 -1 1 | ||
| + | 3 2 1 1 | ||
| + | |||
| + | |||
| + | |||
| + | Step 2:Find the sum of (X-M)2 | ||
| + | 1+0+1+1+1 = 4 | ||
| + | |||
| + | Step 3:N = 5, the total number of values.Find N-1. | ||
| + | 5-1 = 4 | ||
| + | |||
| + | Step 4:Now find Standard Deviation using the formula. | ||
| + | √4/√4 = 1 | ||
= '''Individual School Pages''' = | = '''Individual School Pages''' = | ||
Revision as of 05:11, 31 May 2010
Contents
Variability of the Mid-IR Sky Proposal
Here is the link to our Spring 2010 proposal http://coolcosmos.ipac.caltech.edu/cosmic_classroom/teacher_research/r4-variab/variabProposal.pdf
Variability of the Mid-IR Sky Summer visit
We will be arriving on Thursday Aug 5, departing Aug 9 in hopes of working the three full days of Aug 6, 7 and 8. CLICK HERE for details
Generating Light Curves - APT and Excel
You can find info to help you practice using APT to generate light curves on this page.
Standard Deviation for Dummies
Our Astronomers said it would be important for us to understand standard deviation. We found the button on Excel that calculates it for us, but doesn't really explain what it is. Here's an explanation and example.
Standard deviation is a statistical measure of spread or variability. The standard deviation is tells you how closely the data are clustered around the average. We want to use the aperture and background subtraction settings that give us the smallest standard deviation for a star that is not varying. Our varying stars will of course have large standard deviations because they ARE varying.
Standard Deviation standard deviation formula
where Σ = Sum of X = Individual score M = Mean (average) of all scores N = Sample size (Number of scores)
Standard Deviation Method1 Example: To find the Standard deviation of 1,2,3,4,5.
Step 1: Calculate the mean (average) and deviation.
X M (X-M) (X-M)2 3 2 1 1 2 2 0 0 1 2 -1 1 1 2 -1 1 3 2 1 1
 Step 2:Find the sum of (X-M)2
           1+0+1+1+1 = 4
 Step 3:N = 5, the total number of values.Find N-1.
           5-1 = 4
 Step 4:Now find Standard Deviation using the formula.
           √4/√4 = 1
Individual School Pages
Lincoln-Way North High School in Frankfort, Illinois
 Teacher - Peggy Piper - Students - Joey R. - Rebecca R. - Justin C.
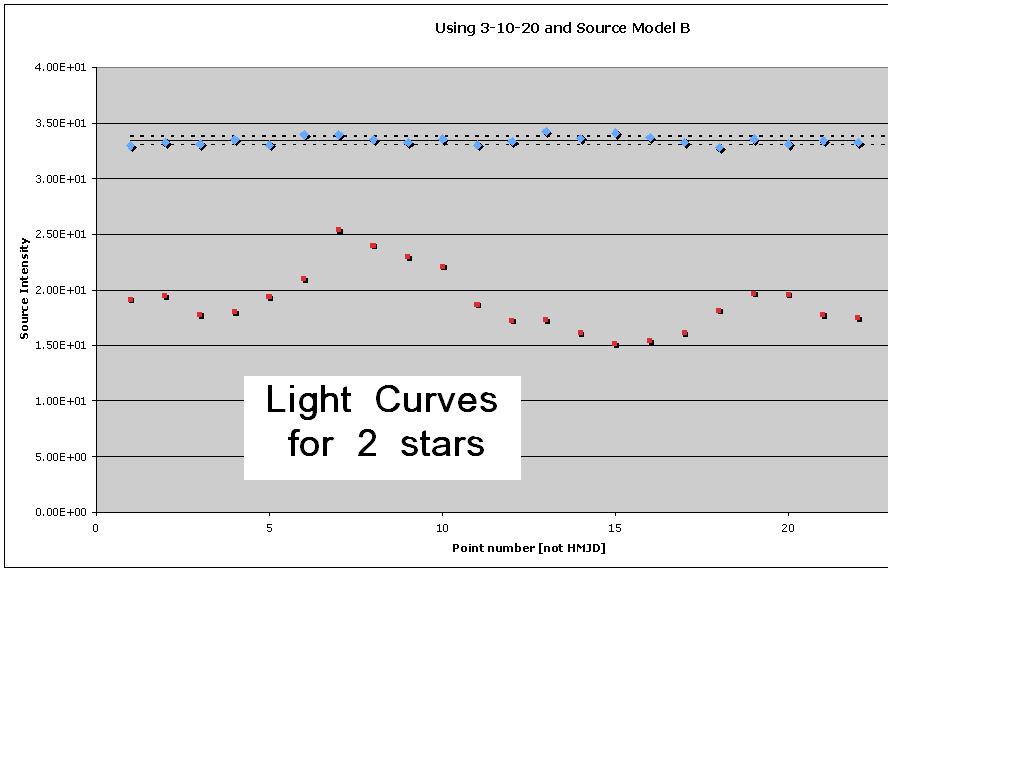
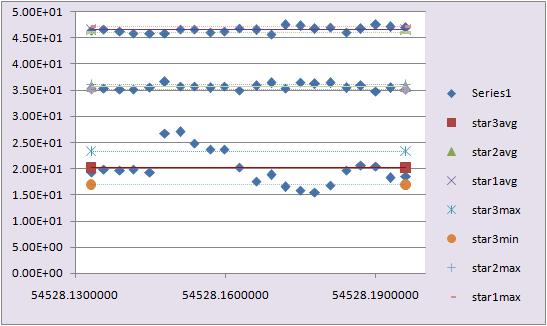
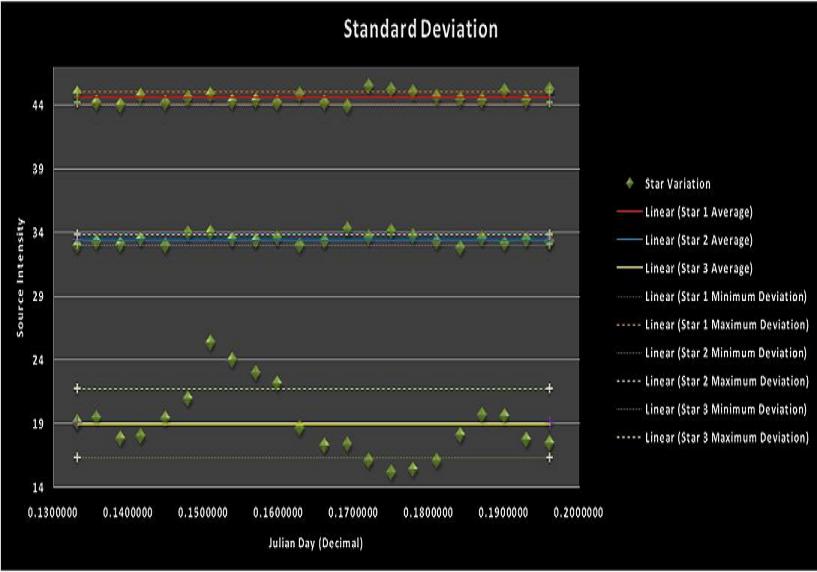
Here are our light curves with standard deviations for the three test stars using Source Model B.
From top to bottom in each graph, they are stars #1, #2, and #3.
Mrs. P Organization points
- change the order of these images so smallest aperature 1st
- look in working data files and list your standard deviations for each star
- would be nice if they were all the same scale:)
- the big white space can be cropped out in paint I believe
Mrs. P Question to you - which aperature background should we choose? Why?
Rebecca's Data for Aperture 5, Background 5 10
 Joey's Data for Aperture 3, Background 10 20
 Joey's Data for Aperture 10, Background 12 20
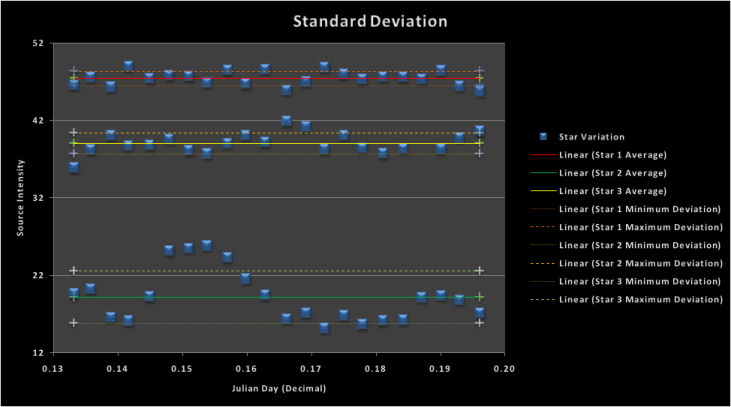
CLICK HERE for our working data
LWN Student Practice Pages
Niles West High School in Skokie, Illinois
Media:APT_star_1_and_2.xls
Teacher - Rich DeCoster
Student - Alexander
Student - Aneesh
North Middle School, Great Falls, Montana
click on title above to get page to edit
Teacher - Beth Thomas
Student - Drew B.
Student - Dallas F.
Summer Discussion Topics
How Does Spitzer Work
Physical Aspects
IR Channels
Variable Stars
Our Glorious Leaders
Most Definitely a couple of Cool Dudes
Here is link to ‘‘DARK MATTER’’ IN ACCRETION DISKS by Steve Howell and Don Hoard that is of interest
Other items
This is Rich. I hope I am not causing confusion. It is 11:15 am CST on Friday Jan. 22, 2010. I am trying to see what this does, since I have "editing" status here. Is this something we use instead of email, or is it a place to create documents that we edit together? Rich ps-Should something like this be in the "discussion" tab rather than the "article" tab?
Hi Rich - no, you're not causing confusion, you're doing it exactly right! These pages under "current research activities" are really sort of "shared white boards". The other half of the wiki (under "research tools") are more articles, and in those cases, yes, questions should go into the discussion pages. I copied some headers in here, but please see some of the "current research activity" pages for the other current teams to see how they are using their pages. (e.g., cg4's page) Oh, and you can use this for whatever you want -- proposal preparation, conversation, sharing plots, brainstorming, etc. --Rebull 13:12, 22 January 2010 (PST)
