What is a periodogram?
From CoolWiki
Jump to navigationJump to search
This is from material originally developed by Peter Plavchan, NStED/IPAC.
What is a periodogram?
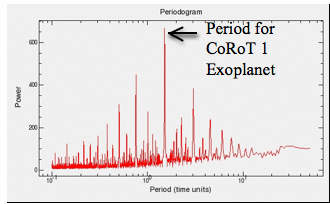
A periodogram calculates the significance of different frequencies in time-series data to identify any intrinsic periodic signals.
A periodogram is similar to the Fourier Transform, but is optimized for unevenly time-sampled data, and for different shapes in periodic signals.
A periodogram is brute-force. Many different frequencies are evaluated and candidate periodic signals.
The statistical significance of each frequency is computed based upon a series of algebraic operations that depend on the particular algorithm used and periodic signal shape assumed.

