Aperture Photometry Overview
Contents
Aperture Photometry Overview
Much of the first several paragraphs on aperture photometry from ground-based telescopes was originally ruthlessly copied without permission from the document entitled "Photometry Using IRAF" by Lisa A. Wells, from 1994, found on the IRAF photometry documentation page.
There are many techniques involved in doing aperture photometry, and these methods vary from one astronomer to another. Some observers use large apertures for their measurements to account for seeing, tracking, and focus variations (which vary with time for ground-based observations), while others use small apertures and apply aperture corrections. The sky algorithm used may vary according to the chip characteristics and the data. There are a number of ways to do the standard calibration, so if you are planning ground-based observations, be sure to observe standards in a way that is compatible with the calibration package you wish to use.
Space-based data does not have to worry about variations in seeing and focus (generally), and the sky background is a function primarily of wavelength and the direction in which you are looking. Moreover, space-based data usually arrive on your desktop already calibrated. So, space-based data are much easier to process than ground-based data. However, you still need to use care in selecting your photometry reduction parameters, because it is very easy to shoot yourself in the foot.
Some references on the theory and techniques of aperture photometry are
- Golay, M., "Introduction to Astronomical Photometry," D. Reidel Publishing, Dordrecht, Holland
- Hardie, Robert H., 1962, in "Stars and Stellar Systems," Vol. 2, "Astronomical Techniques", ed. W. A. Hiltner, University of Chicago Press, 178
- Harris, W. E., 1990, PASP, 102, 949
- Harris, W. E., FitzGerald, M. P., and Reed, B. C., 1981, PASP, 93, 507
- Howell, S. B., 1989, PASP, 101, 616
- Howell, S. B., (ed.), 1991, "Astronomical CCD Observing and Reduction Techniques", ASP Conf. Series, Vol. 23... in particular, see DaCosta, G., "Basic Photometry Techniques", page 90
- Philip, A. G. Davis, (ed.), 1979, "Problems of Calibration of Multicolor Photometric Systems," Dudley Observatory, Schenectady, New York
- Stetson, P. B., 1987, PASP, 99, 191
- Stetson, P. B., 1990, PASP, 102, 932
- Stetson, P. B., and Harris, W. E., 1988, AJ, 96, 909
The basic principle of aperture photometry is to sum up the observed flux within a given radius from the center of an object, then subtract the total contribution of the sky background within the same region, leaving only the flux from the object to calculate an instrumental magnitude. The aperture size is important, since seeing, tracking, and focus errors affect the amount of flux within the stellar profile. The noise grows linearly with radius as the stellar flux trails off in the wings of the profile. Increasing the size of the aperture will increase the Poisson shot noise of the background sky and any flat field errors that may be nearby The signal-to-noise ratio of the flux measurement reaches a maximum at an intermediate aperture radius shown by Howell (1989). The use of a smaller radius introduces the problem that the fraction of the total flux measured will vary for objects of different flux from image to image. Aperture corrections must be used in this latter case.
If you are working with ground-based data, you need to worry about extinction corrections to the data, so extinction stars need to be observed and reduced along with the object data. The extinction stars should be observed at airmasses corresponding to the range in airmass of the program objects. Color and zero point corrections are often applied to the instrumental magnitudes as well to put them on the standard system defined by a set of observed standard stars -- these same standard stars can also be used as the extinction stars. These stars should be chosen prior to observing so that their colors bracket those of the program objects -- a good rule of thumb is to have at least a 0.5 magnitude range in the colors of the standards to determine reasonable calibrations.
Aperture Photometry Steps
Once you have calibrated data (ground- or space-based), the basic series of steps for doing aperture photometry are as follows, with many different options and parameters for each step:
- Detect objects in image, if doing this automatically (human eyes are good at this).
- Determine center of object.
- Determine background -- e.g. determine what the signal would be in the aperture if the star was not there. (Usually means defining an annulus around the object at some distance from it.)
- Summing up the light in the object (define the size of the aperture to use, subtracting off the background).
- Apply aperture corrections, if necessary.
- Check your numbers!
Detecting objects
If you're doing photometry by hand, it's easy to recognize at least the brighter sources just using your own eye. But, if you're doing photometry automatically (like with MOPEX), you need to teach the computer what to look for. I think it's probably easy to imagine the difference between finding bright single point sources on a flat black background, versus trying to find a wide variety of point source brightnesses, some crowded, inamongst complicated nebulosity. If that's not clear, imagine just this - you probably can imagine having the computer look for peaks that are at least several times brighter than a dark background, but then what happens when you raise the background level by a constant amount? The sources are less easily distinguished above the background. MOPEX has many different parameters (check the online help files) that you can control to affect its ability to detect sources.
Centroiding
Centroiding is finding the center of the object. If your aperture is not centered exactly right on the object, you will derive incorrect photometry. (You can empirically discover this in APT by manually changing the center (even the initial center guess) and watching how the photometry changes.) Usually the computer can centroid to within a small fraction of a pixel. This is easier for the computer (or a human) when the star is well-sampled, e.g., when many pixels define the point sources. For images like those for IRAC-1, usually only 2 pixels define a detection, so the results are more sensitive to your ability to centroid. Neither MOPEX nor APT have many parameters that you can control to affect this algorithm in their respective routines. APT provides a way to interactively graph the radial profile of the PSF, which will give an indication of how well the centroiding is doing.
Determining background
You need to define an annulus (a ring) that is far enough from the star that you have avoided most of the light in the object, but close enough that the flux you measure is still representative of the true background under your source. The annulus needs to be thick enough that you have enough pixels included that the noise from the background estimate doesn't adversely affect the total error in the measured flux. You need to decide if you should take the mean, median, or mode of the pixels in the background, or some other estimator. Because an annulus might include a nearby source (or cosmic ray), you need to decide how many (if any) pixels should be thrown out of the annulus background calculation, and the criteria for doing so. APT provides some tools to interactively explore some of these options. You need to decide how to scale the background you measure to be appropriate for the size of the annulus centered on your source (are the total pixel areas the same in the annulus and aperture?). If you are using ground-based data, you should use the same annulus (and aperture, see next item) for every one of your calibration and target objects. If you are using Spitzer data, you need to be aware of what annulus (and aperture) were used by the instrument teams to calibrate the instrument so that you can scale your results accordingly. (See information on aperture corrections below.) MOPEX has options for all of this (and more); APT has options for most of this. In all cases, you need to be aware of the pixel size of your mosaic and how it corresponds to arcseconds. This information is in the FITS header of any mosaic.
Summing up the light in the object
You need to define an aperture that is close enough to the star that it includes most of the flux, but not so far away that it adds a lot of sky, because you want to count just the flux from the object, not increase the noise by counting up lots of sky. For bright objects, the PSF can appear quite large, while for faint sources, the PSF can appear quite small. However, the PSF is a function of the telescope+CCD+filters, etc., and in reality is ALWAYS the same shape. You're just seeing different fractions of it for bright and faint sources. To make things easier (and minimize errors), you should pick the same aperture for all of your data, bright and faint sources. Thus, you need to pick an aperture (and annulus, see previous item) that works reasonably well for both bright and faint sources. The graph that describes how the flux changes as your aperture changes is called the "curve of growth", and APT provides an interactive way to explore these settings. If you are using ground-based data, you should use the same aperture (and annulus, see previous item) for your calibration and target objects. If you are using Spitzer data, you need to be aware of what aperture (and annulus) were used by the instrument teams to calibrate the instrument so that you can scale your results accordingly. (See information on aperture corrections below.) MOPEX has options for all of this (and more); APT has options for most of this. In all cases, you need to be aware of the pixel size of your mosaic and how it corresponds to arcseconds. This information is in the FITS header of any mosaic.
Applying aperture corrections
If you are calibrating your own data, then as long as you use the same aperture and annulus for everything (targets and calibrators), you don't need to apply aperture corrections. However, for space-based data such as Spitzer (or any data that someone else calibrated for you), you need to be aware of what aperture and annulus were used to calibrate the instrument so that you can scale your results accordingly. Both IRAC and MIPS have tabulated the aperture corrections they derive for the apertures and annuli they suggest you use (if those links are broken, go to the SSC website and google for IRAC or MIPS aperture corrections). Several suggested aperture/annulus pairs are tabulated on both pages, along with the corrections. Note that one lists NATIVE PIXELS and the other lists ARCSEC, and you should double-check exactly what you're using and what pixel size you have in order to make sure you are using the right thing. I recommend choosing one set of those predefined parameters, ideally such that the correction you need to use is not particularly large. Note that you should not use the same parameters they use for their calibration objects, which are usually much brighter than most of the objects in your target frame. You should choose one of the other tabulated options. Note that if you choose to use other parameters entirely (not one of those listed), you will need to interpolate among the tabulated values to find the aperture correction value you should use. In all cases, you need to be aware of the pixel size of your mosaic and how it corresponds to arcseconds. This information is in the FITS header of any mosaic. To actually apply the aperture corrections, multiply the flux you have calculated by the aperture correction value. Neither APT nor MOPEX will do this automatically!
Checking your photometry!
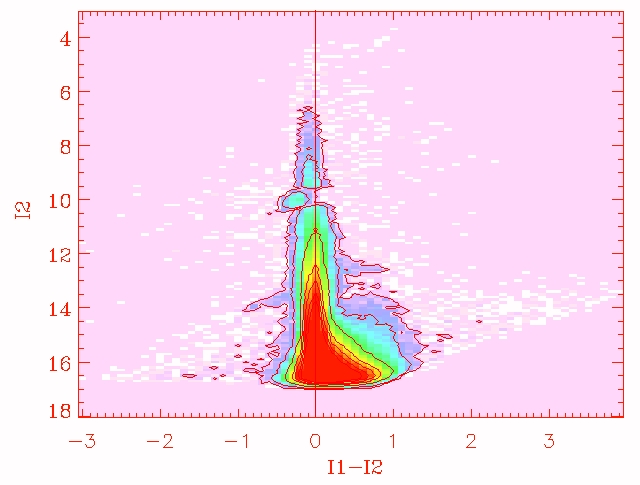
After you do all of this, the next steps are to check your work. You should check it in at least two ways. Overlay your detections on images, make sure that you are detecting real sources and not noise. Merge your photometry such that measurements for the same object across many bands are tabulated, and make some color-color plots and color-magnitude plots and see if (a) the plots look like you expect, and (b) if the scatter in various parts of the diagram looks like you expect. Just because the computer comes up with a number does not mean it is right!! For example, if you plot up [3.6] vs. [3.6]-[4.5] for a galactic observation, the bulk of the objects you detect should be unadorned photospheres, so they should have zero color, with larger scatter at the fainter end. If the locus of most of your points is not in fact centered on zero, and/or if it's not straight (until saturation at the bright end), then you've done something wrong and you should go back and fiddle with some of your parameters until it is straight and centered on zero, or you understand why it's not.
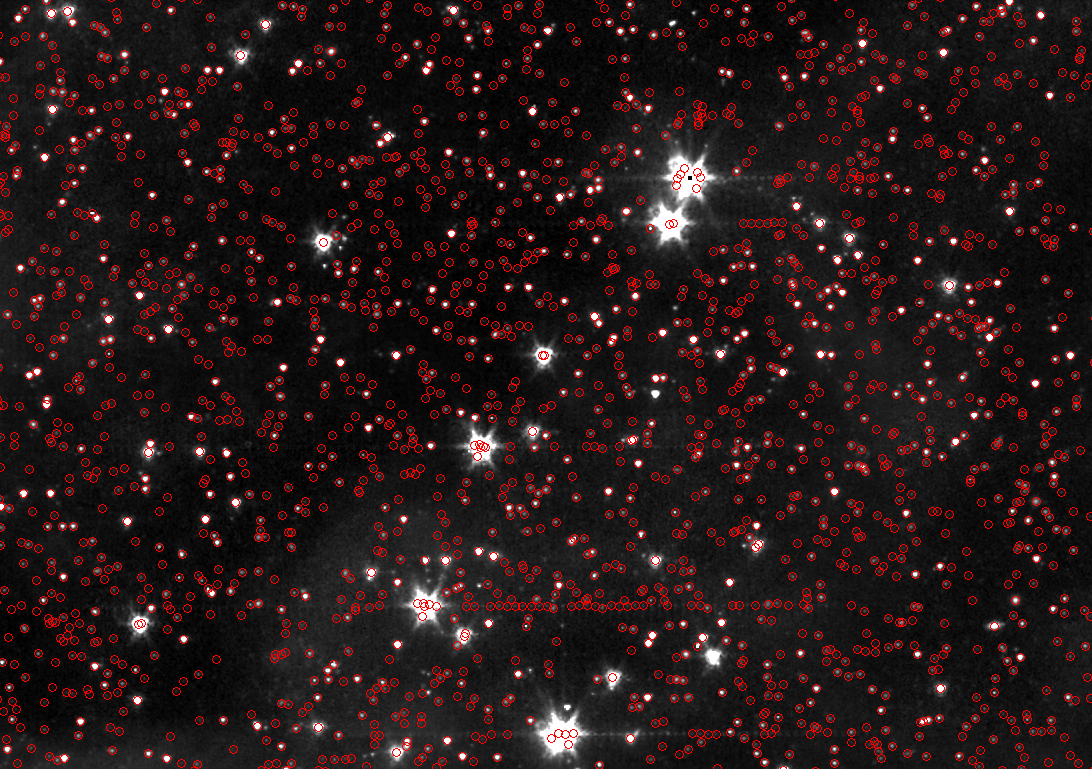
 Example 1: Above is a graphic demonstrating the APEX-detected sources on an IRAC-1 mosaic. Note that in most cases, it's doing pretty well - there is a real source visible within each red circle. BUT it clearly is having problems with the very bright and/or saturated sources, and it's detecting "sources" in the trail of image artifacts around the bright sources. I also see a resolved source for which it has decided the central point is a point source, and there are some legitimate point sources I can see by eye which the computer has not found. There is definitely a point of diminishing returns -- you have to decide which objects you're interested in, how complete you want to be, and whether you can sustain "false" sources in this source list and/or missing sources in this source list. It could be that this is fine; false sources will fall away as having been detected in only one band, and sources in which you are interested that are missing from the source list can be manually added later. It could be, though, that you need to be more complete in the automatic extraction, in which case you need to get in and fiddle with the parameters (in this case, from APEX).
Example 2: Here is a plot of I2 ([4.5]) vs. I1-I2 ([3.6]-[4.5]) from an early reduction of data for a very large mosaic. There are so many points here (more than half a million) that it's been plotted as countours of point density rather than individual points. Most of them have zero [3.6]-[4.5] color, with a larger scatter near fainter magnitudes -- this is good, this is what we want. But there is something wrong near [4.5]~10. Why is there an abrupt shift left? Something's wrong with the the photometry, and we need to go investigate what could be going wrong near that brightness level. I suspect that it has something to do with the way we are merging the photometry from the short and long frames, but it might be something else.
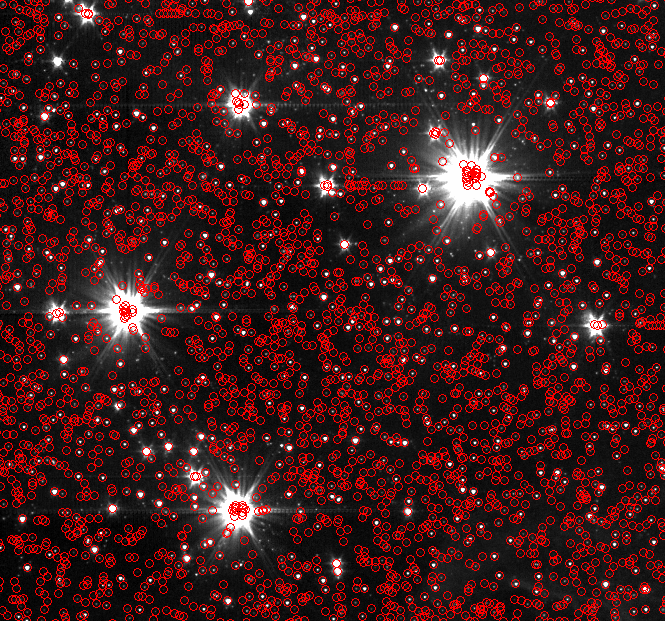
Bonus question
Knowing what you do from the above discussion, why is the computer having trouble finding the fainter sources around these bright sources?

