Wendi's table of all data sources
Finding cluster members, originally known as "Luisa’s Table of Characteristics of Young Stars for Determining Cluster Members", may be of some interest.
The table
Wendi's table orignally included (data) source, type (wavelength), and reasoning. Anything else to add?
| Data source | Wavelength(s) | Why we should care | Additional notes on this data source |
| Getman et al. 2007 | X-ray | X-rays trace stellar magnetic activity, can reduce number of foreground/background objects by requiring X-ray detections. Young stars are bright in X-rays because they are rotating quickly and therefore flaring a lot. | 25 Globule sources identified as YSOs in the center. 117 sources tabulated in Table 1. Also, entire Nisini catalog included in Table 3. (Nisini is deeper JHK than 2MASS.) SEDs in Figure 5 good for comparison to ours. |
| Choudhury et al. 2010 | optical (including Halpha, IRAC, MIPS, 2MASS), some spectra (from which they got spectral types) | very similar data sets, and analysis (at least to aspire to), though over a smaller area, and certainly seems to be reliable in terms of data reduction and coordinate accuracy. Identified 118 sources, 40 YSOs+13 candidates. | published whole table. |
| Chauhan et al. 2009 | BVI, IRAC | identified only 18 sources, but still useful, also over small region. Experience in BRC 27 with this paper suggests we need to be cautious with their data tables. Check to make sure sources really match. | published just the YSOs. |
| Ogura et al. 2002 | Halpha = 6563 A | because young accreting stars are bright in Halpha | We have updated the coordinates for the BRC 38 sources listed. Also note that they have finding charts of their sources, and of the HH sources they have identified here. Objects tabulated in this paper with small Ha EQWs are probably just chromospheric activity and not accretion. |
| Barentsen et al. 2011 | r', i', Halpha (IPHAS) | optical data will help us flesh out the SED, optical CMDs can help us weed out contamination | they tabulate candidates and rejects (useful to know things they have weeded out as members) |
| IPHAS | r', i', Halpha | optical data will help us flesh out the SED, optical CMDs can help us weed out contamination | i have the whole catalog from Barentsen himself, not just the TTauris or rejected candidates. |
| Nakano et al. 2012 | Halpha, IPHAS, Akari, crossmatching to prior literature. | similar issues as to Barentsen, IPHAS. | only one object with Akari data tabulated for BRC 38 (our region specifically) |
| 2MASS | JHKs over whole region, not just a subset | point sources can be matched across bands | over whole region! |
| Beltran et al. 2009 | NIR (JHK') and H2 (1.2-2.2 um) (deeper than 2MASS!) | link the point sources across all available bands; look for complex H2 structures, unclear if we will find them. | Further data on BIMA 1,2,3 and Source C |
| WISE | 3.4, 4.6, 12, 22 microns | primary way of finding our YSOs! | over whole sky, has done photometry for us but BE CAREFUL about things in catalog claiming to be real sources at 12 and 22 um! |
| AKARI | shortest two bands are 9 and 18 um. | can be used to flesh out SEDs but only for the brightest sources! | no image provided, only catalogs, so use with caution! |
| Spitzer | IRAC: 3.6, 4.5, 5.8, 8 um; MIPS: 24, 70, 160 um. | really useful for images and SED help, but don't have over a large area | we will have to do photometry ourselves in this region! |
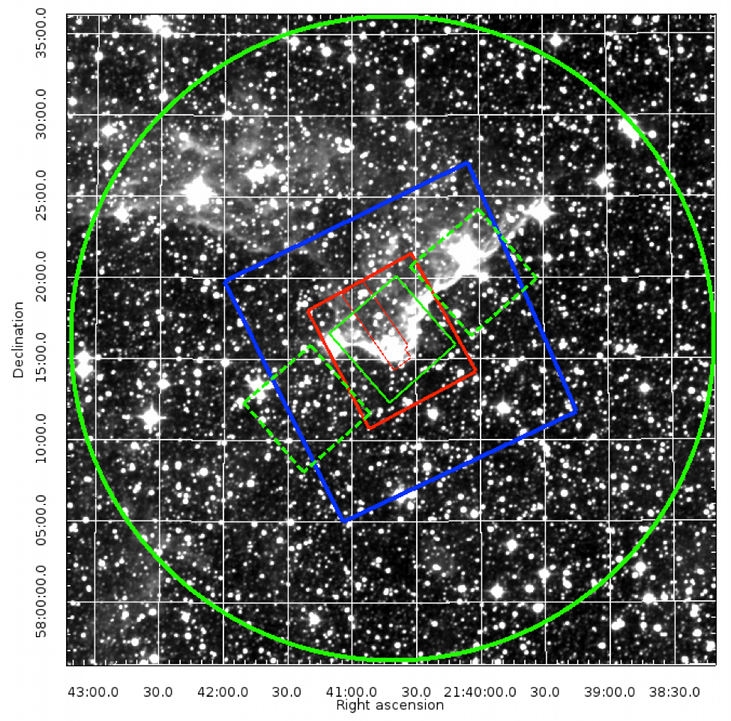
Areas covered (from our proposal)
Figure 4: This WISE-4 (22μm) greyscale image of the BRC 38 region (~40’ on a side) is the region of proposed study; the green circle is 20’ in radius (~40’ diameter). The central green square is the region covered by all four Spitzer IRAC bands. The green dashed-line square to the lower left is the serendipitous IRAC 2 & 4 (4.8 & 8 μm) data and the green dashed-line square in the upper right is the serendipitous IRAC 1 & 3 (3.6 & 5.8 μm) data. The red square shows the Spitzer MIPS -24 μm coverage and the red rectangle is MIPS-70 μm coverage. The large blue box in the center is the Chandra field of view for the observation discussed in Getman et al. (2007). The optical data from Chauhan et al. (2011), Choudhury et al. (2010), and Ogura et al. (2002) are largely within the region of IRAC 4-band coverage. The deep JHK data from Beltrán et al. (2009) are in a region comparable to the IRAC 4-band coverage.
